Dirt Bike Market Size and Share
Market Overview
| Study Period | 2019 - 2031 |
|---|---|
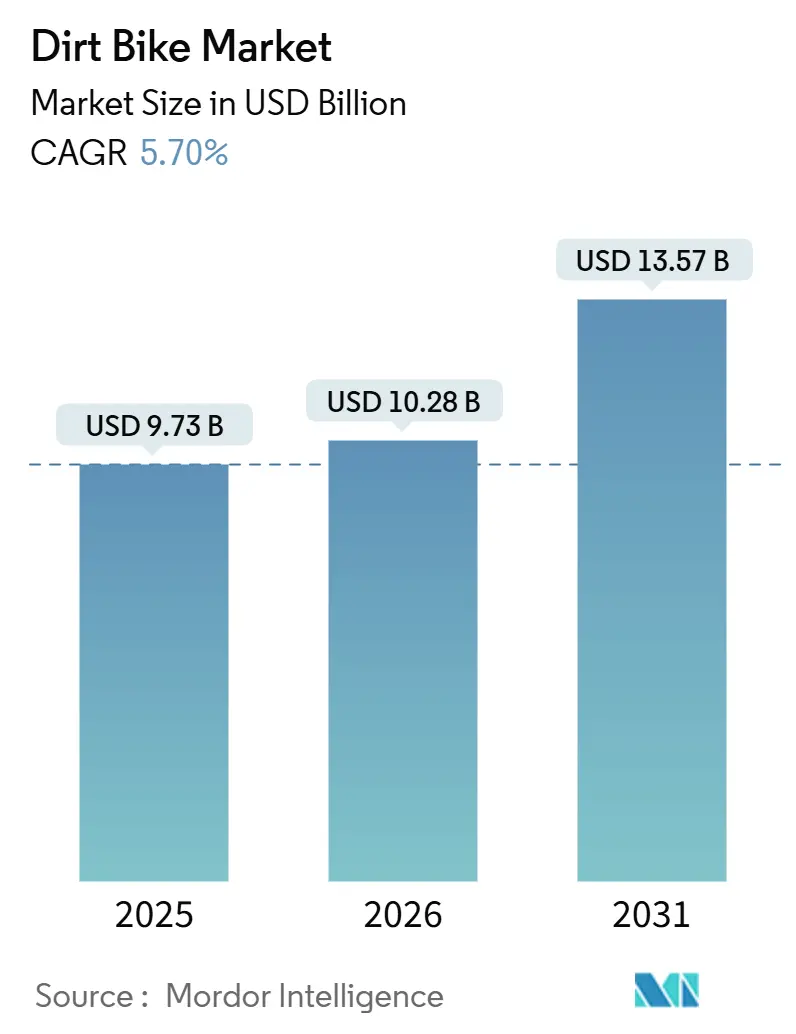
| Market Size (2026) | USD 10.28 Billion |
| Market Size (2031) | USD 13.57 Billion |
| Growth Rate (2026 - 2031) | 5.70% CAGR |
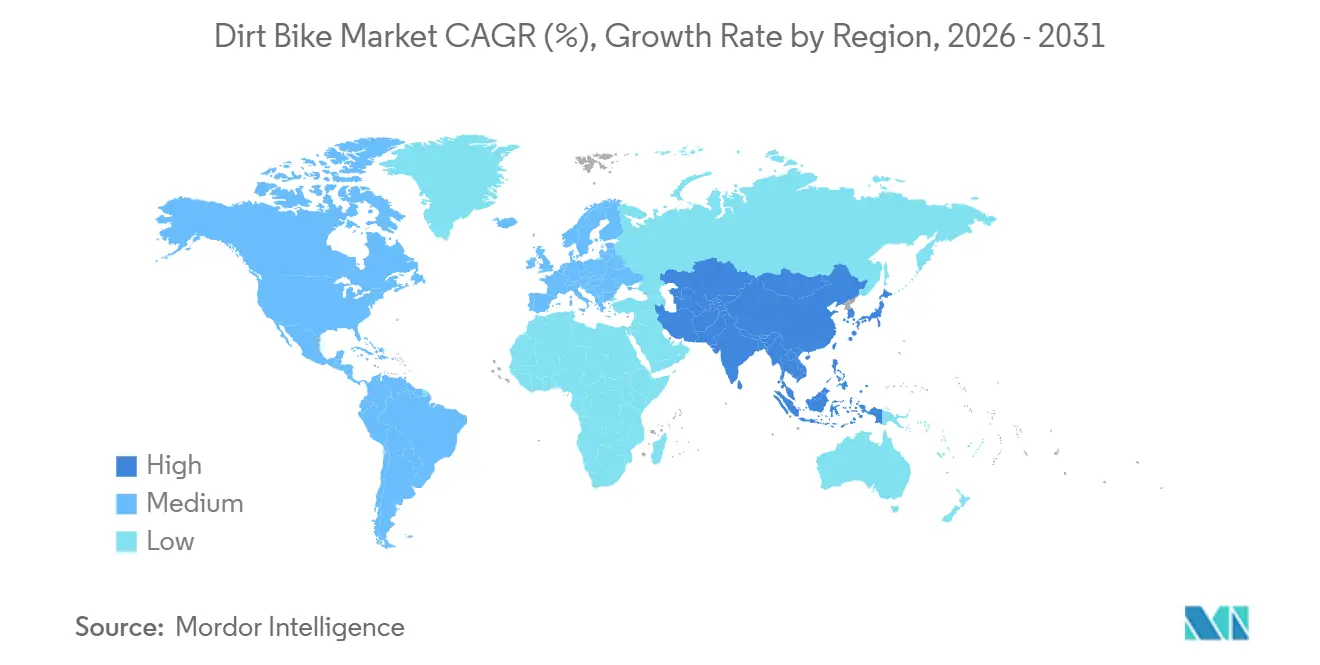
| Fastest Growing Market | Asia Pacific |
| Largest Market | North America |
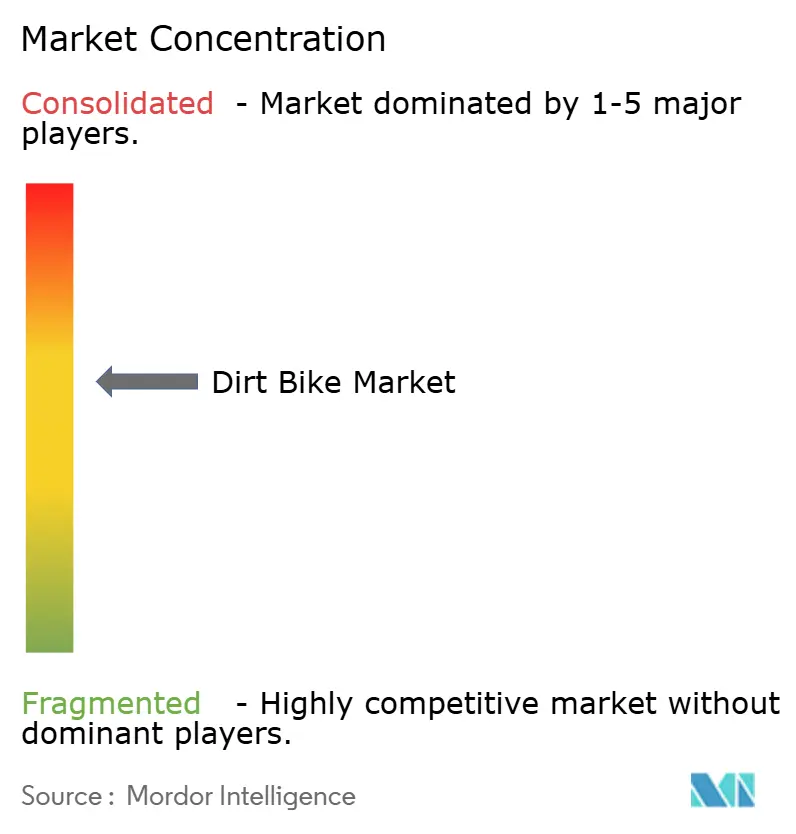
| Market Concentration | Medium |
Major Players *Disclaimer: Major Players sorted in no particular order Image © Mordor Intelligence. Reuse requires attribution under CC BY 4.0. | |
Dirt Bike Market Analysis by Mordor Intelligence
The dirt bike market size is projected to be USD 9.73 billion in 2025, USD 10.28 billion in 2026, and reach USD 13.57 billion by 2031, growing at a CAGR of 5.70% from 2026 to 2031. Demand is underpinned by regulatory pressure for electrification, a steady influx of new amateur riders, and the expansion of adventure tourism that frames dirt bikes as gateway vehicles for remote recreation. Motocross maintains high visibility through broadcast contracts and streaming growth that translate directly into bike sales, while lightweight material innovations cut unsprung mass and improve ride comfort. In parallel, online direct-to-consumer (DTC) channels gain traction as digitally native buyers seek transparent pricing and doorstep delivery, even as dealerships defend share through test rides, trade-in convenience, and financing penetration. Near-term headwinds include land-use restrictions that limit track availability, lithium price volatility that clouds electric cost projections, and rapid tire wear that elevates total cost of ownership, yet policy incentives and cost declines in battery production continue to steer the dirt bike market toward gradual electrification.
Key Report Takeaways
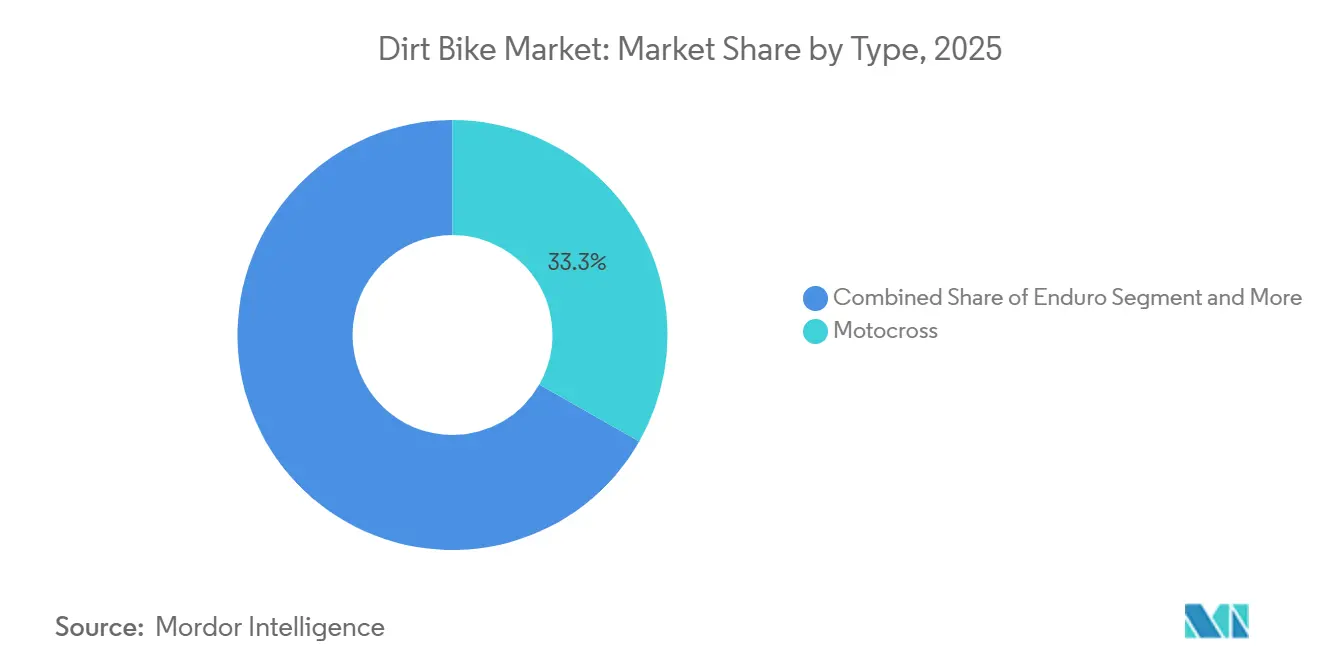
- By type, motocross commanded 33.25% of the dirt bike market share in 2025 and is forecast to expand at a 5.93% CAGR through 2031.
- By propulsion, internal combustion engines retained 72.16% of the dirt bike market in 2025, while electric models recorded the fastest growth at 7.12% CAGR to 2031.
- By engine displacement, the 126–250 cc class held 38.12% share of the dirt bike market size in 2025, but ≤125 cc bikes will grow quickest at 7.56% CAGR between 2026 and 2031.
- By end-user, amateur and recreational riders accounted for 49.03% of demand in 2025 and advanced at a 6.51% CAGR through 2031.
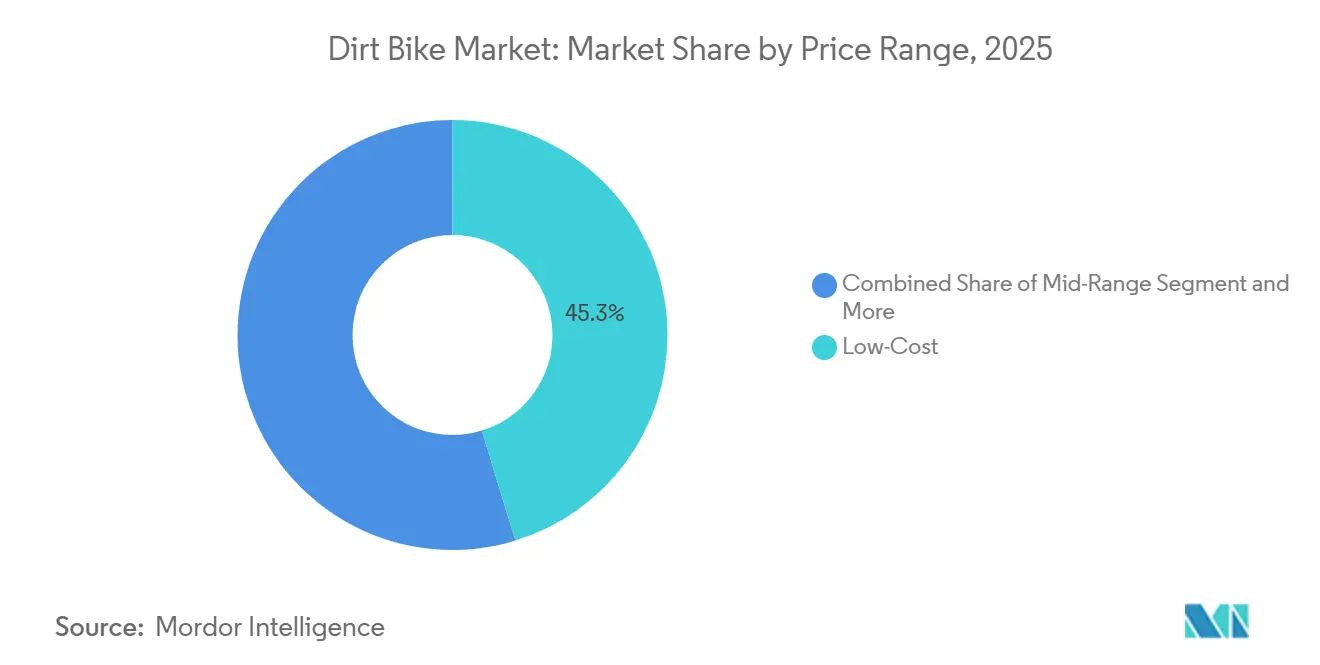
- By price range, low-cost models captured 45.26% of 2025 sales, supported by a 6.35% CAGR that reflects strong uptake in Asia-Pacific.
- By distribution channel, dealerships and showrooms delivered 63.44% of 2025 unit sales, although online DTC sales post an 11.24% CAGR that reshapes the distribution mix.
- By geography, North America accounted for 35.12% sales in 2025, while the Asia-Pacific will expand at a a 6.81% CAGR.
Note: Market size and forecast figures in this report are generated using Mordor Intelligence’s proprietary estimation framework, updated with the latest available data and insights as of January 2026.
Global Dirt Bike Market Trends and Insights
Drivers Impact Analysis
| Driver | (~) % Impact on CAGR Forecast | Geographic Relevance | Impact Timeline |
|---|---|---|---|
| Motocross and Off-Road Racing | +1.2% | Global, high in North America and Europe | Short term (≤2 years) |
| Adventure Riding and Tourism | +0.9% | North America, Europe, Asia-Pacific | Medium term (2-4 years) |
| Push Toward Electric Dirt Bikes | +0.8% | North America, Europe, China | Medium term (2-4 years) |
| Materials and Suspension Innovations | +0.7% | Global, led by United States and Europe OEMs | Long term (≥4 years) |
| Expansion of Entry-Level Models | +0.6% | Asia-Pacific, South America | Short term (≤2 years) |
| OEM-Run E-Sport / MX Platforms | +0.3% | North America, Europe, urban Asia | Medium term (2-4 years) |
| Source: Mordor Intelligence | |||
Rising Popularity of Motocross and Off-Road Racing
In 2025, the Pro Motocross Championship experienced a significant increase in streaming viewership and attracted a large number of live attendees at various United States rounds, underscoring motocross's pivotal role in driving dirt bike sales. European factory riders such as Jorge Prado and Antonio Cairoli now compete in the United States, underscoring the sport’s global convergence and escalating brand exposure. Grass-roots programs respond in kind: the Monster Energy AMA Amateur National Motocross Championship integrated the Prospect app to track rankings and share video clips, modernizing youth engagement. The United Kingdom’s Auto-Cycle Union created new women’s youth categories that widen the participant funnel and stimulate family bike purchases. As media outlets monetize live rights and digital highlights, sponsors increase purse levels, further fueling a cycle in which visibility drives participation, and participation sustains equipment turnover.
Growth in Recreational Adventure Riding and Tourism
Across several United States routes, Backcountry Discovery Routes spurred significant tourism spending. This underscores the allure of multi-day dual-sport trips, particularly among affluent riders keen on premium gear. The Bureau of Land Management reported substantial recreation visits to public lands, with a notable uptick in off-highway vehicle permits, highlighting the robust demand for trails. California’s Off-Highway Vehicle Access and Enhancement Plan has introduced new riding areas within a short radius of metro centers. This initiative seamlessly integrates dirt biking with family activities like camping, fishing, and hiking. Such policy decisions bolster the dirt bike market, positioning off-road motorcycles as gateways to diverse outdoor pursuits. In response, manufacturers are rolling out lightweight dual-sport models, equipped with luggage racks and wide-ratio transmissions, striking a balance between trail agility and backroad comfort.
Regulatory Push Toward Electric Dirt Bikes
California adopted staged zero-emission motorcycle targets that begin with a 10% electric sales requirement in model year 2028 and rise to 50% by 2035, forcing manufacturers to accelerate battery platform rollouts and invest in dealer charging infrastructure. Europe mirrors this trajectory by extending UN Regulation 155 cybersecurity rules to powered two-wheelers, raising compliance costs yet enabling secure over-the-air battery updates [1]“UN Regulation No. 155 – Cyber Security,” United Nations Economic Commission for Europe, unece.org. The Fédération Internationale de Motocyclisme now mandates IP66D protection and drop-test certification for high-voltage components, setting a global engineering baseline for electric dirt bikes. These overlapping policies favor incumbents with capital depth but also create room for specialized start-ups that can meet safety rules with modular, lower-cost battery packs. The combined effect adds short-run cost pressure yet accelerates medium-term demand for electric models that comply with both emissions and cybersecurity statutes.
Lightweight Materials and Suspension Innovations
Fox Factory patented a dual-piston shock that balances pressure across the piston face, cuts cavitation, and lets engineers use softer gas charges without bottoming, thereby improving ride comfort and chassis control [2]“Dual-Piston Shock Patent Application,” Fox Factory, ridefox.com. A separate tuned-mass damper concept attaches magnetorheological components to handlebars or axles and targets vibration frequencies around 10 Hz, reducing rider fatigue on rough courses. Textron obtained patents for longer magnetorheological valves that boost the damping control ratio and resist thermal fade, a feature welcomed by riders who hammer through whoops and rock gardens. These advances trim unsprung mass, expand compression-rebound tuning windows, and facilitate electronic adjusters that adapt suspensions to rider weight and terrain in real time, although added complexity elevates unit costs.
Restraints Impact Analysis
| Restraint | (~) % Impact on CAGR Forecast | Geographic Relevance | Impact Timeline |
|---|---|---|---|
| Purchase and Maintenance Costs | -0.9% | Global, pronounced in Asia-Pacific and South America | Short term (≤2 years) |
| Closures Due to Land-Use and Noise | -0.7% | North America, Europe, Australia | Medium term (2-4 years) |
| Lithium Price Volatility | -0.5% | Global | Short term (≤2 years) |
| Tire Attrition Elevating TCO | -0.4% | Global | Long term (≥4 years) |
| Source: Mordor Intelligence | |||
High Purchase and Maintenance Costs
Studies from Argonne reveal that while electric motorcycles (e-motorcycles) enjoy a price premium over internal combustion engine (ICE) counterparts, they also benefit from reduced maintenance costs. This premium largely stems from enhancements like rugged battery housings and reinforced frames, which add high costs per unit. On the flip side, ICE motorcycles grapple with rising costs. Stricter evaporative and diagnostic mandates compel original equipment manufacturers (OEMs) to undertake pricier fuel-system revisions, consequently driving up retail prices. Additionally, motocross enthusiasts face significant expenses: high-wear parts and piston and valve-train refreshes required frequently can result in substantial annual costs for active racers. Looking ahead, while battery pack costs are anticipated to drop by 2032, unpredictable volatility scenarios might push the timeline for achieving price parity further out. This intricate expense landscape carves the dirt bike market into two distinct segments: affluent enthusiasts and budget-conscious riders, the latter often gravitating towards used bikes or more affordable Chinese imports.
Track Closures Due to Land-Use and Noise Rules
Seasonal riding restrictions in California lapsed at the end of 2024, yet local agencies continue to impose site-specific limits that narrow public access. Oregon re-centralized noise rulemaking under its Parks Commission, laying the groundwork for stricter decibel caps that could shorten practice windows [3]“Motorized Vehicle Noise Rulemaking,” Oregon Parks and Recreation Department, oregon.gov. In Australia, operational impacts are becoming evident. Albany Motorsport Park has limited motocross events to a few Sundays each year and is set to enforce stricter noise thresholds by 2026. Similarly, the National Park Service has shut down certain trail segments to street-legal off-highway vehicles. This move fragments popular loop rides and forces riders to increase their trailer miles. With fewer riding venues available, bike utilization diminishes, leading to slower replacement cycles. This trend ultimately stifles volume growth in densely populated areas.
Segment Analysis
By Type: Motocross Sustains Leadership Through Media Visibility
Motocross contributed 33.25% to the dirt bike market in 2025 and is set to grow at 5.93% CAGR through robust broadcast deals, youth feeder systems, and frequent model upgrades that accelerate equipment turnover. In contrast, enduro and trail categories appeal to riders who favor technical single-track and endurance, resulting in longer ownership cycles. Dual-sport bikes bridge on- and off-road with DOT equipment, while adventure models integrate larger engines and luggage for multi-day travel. Mini and youth classes cultivate future customers; OEM-sponsored financing and trade-in programs lower the entry barrier for families. Ongoing media exposure keeps motocross aspirational, ensuring that this discipline retains primacy within the dirt bike market.
Amateur racers typically replace bikes every one to two seasons to remain competitive, injecting continuous demand into the pipeline. Sponsorship logos on professional machines influence accessory purchases, further lifting aftermarket value. Enduro riders focus on reliability, fueling steady parts sales but slower new-unit turnover. Dual-sport owners weigh emissions compliance against off-road capability, often accepting some street bias for freeway legality. Adventure bikes pull older demographics seeking comfort and load capacity, but surrender technical prowess in tight terrain. Youth models are lightweight, automatic, and affordable, supporting parental purchasing decisions and broadening the participant base. Combined, these dynamics ensure that the dirt bike market size continues to expand across multiple consumer cohorts while motocross maintains the flagship role.
Note: Segment shares of all individual segments available upon report purchase
By Propulsion: ICE Retains Majority Yet Electric Gains Speed
Internal combustion engines held 72.16% of 2025 unit sales, underscoring entrenched dealer service networks, fast refueling, and familiar performance envelopes. Even so, electric bikes deliver a 7.12% CAGR to 2031, buoyed by tighter emissions laws and lower running costs. California targets 50% electric motorcycle sales by 2035, a policy that cascades nationwide as manufacturers minimize SKU complexity. India and Southeast Asia drive volume through subsidies and battery-swap stations, revealing the cost-effectiveness of small-pack designs in dense urban corridors.
ICE powertrains excel in remote endurance events where range and refuel speed dominate, but they face rising costs from evaporative and OBD mandates. Electric bikes shine in park environments where a 30–60 mile range suffices, noise caps favor silent operation, and regenerative braking cuts maintenance. Battery weight remains a hurdle, though continuous energy-density gains chip away at this penalty. Swappable pack systems answer charge downtime but require standardization that only China currently offers at scale. Therefore, propulsion share will diverge by use case, with urban-proximate parks tilting electric while back-country and race formats keep ICE in command.
By Engine Displacement: Entry-Level Growth Steers Future Demand
The 126–250 cc segment led 2025 volume at 38.12% of the dirt bike market size, valued for its balance between performance and manageable maintenance. Yet, ≤125 cc models are forecast to post the highest 7.56% CAGR as incentives, lax licensing, and electric simplicity welcome novice riders. Mid-sized 251–500 cc machines suit dual-sport commuters who need highway speed, whereas >500 cc adventure models cater to affluent long-haul travelers.
OEMs emphasize lightweight frames and reduced seat heights in ≤125 cc lines, targeting female and youth demographics. Battery packs in this bracket stay below 3 kWh, holding weight near ICE parity. In the core 126–250 cc class, technologies such as variable valve timing and traction control migrate from 450 cc race bikes, refreshing appeal without cost explosion. The 251–500 cc tier confronts cross-shopping against midsize adventure bikes, prompting brands to inject touring comfort and accessory readiness. Large-bore bikes sustain niche loyalty but bump into trail width limits and tighter noise rules. Overall segment interplay points to a pyramid structure where entry-level growth feeds mid-tier upgrades, securing a steady pipeline for the dirt bike industry.
By End-User: Recreational Riders Expand Market Width
Amateurs and recreational users produced 49.03% of the 2025 unit demand and advanced at 6.51% CAGR, signaling dirt bikes’ migration from niche sport to mainstream outdoor pastime. These buyers prioritize electric start, gentle power bands, and low seat heights. Professional race teams generate smaller volume but drive high-margin aftermarket and media exposure. Commercial and rental fleets value reliability, telematics, and service contracts that cap downtime.
Recreational uptake benefits from state park expansions, guided tour operators, and social media communities that lower the intimidation factor for newcomers. Professional teams influence benchmark performance and push component R&D that later cascades to consumer models. Rental outfits supply test-ride experiences that convert vacationers into owners. Defense and industrial users need ruggedness and parts commonality, offering steady, if unspectacular, shipments. Collectively, amateur growth raises baseline volume, while pro, fleet, and institutional segments provide margin ballast.
By Price Range: Low-Cost Tier Fuels Emerging-Market Penetration
Low-cost bikes (sub-USD 5,000) captured 45.26% of global sales in 2025 and grew at a 6.35% CAGR as Chinese and Indian entrants leverage cost-efficient supply chains. Mid-range models at USD 7,000–12,000 cater to intermediate riders wanting fuel injection and adjustable forks without premium sticker shock. Premium bikes above USD 12,000 court racers and affluent adventurers who demand exotic alloys, quick-shifters, and race-spec suspension.
Currency swings in Brazil and Argentina spur buyers toward the low-cost tier, while the consumer in the United States and the EU gravitates to mid-range offerings that blend brand reputation with manageable financing. Premium volumes stay stable, supported by factory contingency programs and brand heritage. Price segmentation is thus three-pronged: low-cost units expand addressable markets, mid-range sustains brand loyalty, and premium cements technological leadership. OEMs increasingly launch stripped-down variants to hedge against commodity price shocks and protect their share in the dirt bike market.
Note: Segment shares of all individual segments available upon report purchase
By Distribution Channel: DTC Accelerates but Dealerships Endure
Dealerships and showrooms delivered 63.44% of 2025 shipments, underpinned by test rides and same-day service turnarounds. However, online DTC sales post an 11.24% CAGR as brands adopt Tesla-style click-to-buy portals with fixed pricing and home delivery. Specialty retailers remain niche curators for hard-to-source parts and apparel.
Pandemic-era habits normalized big-ticket e-commerce, and cost transparency pressures dealer gross margins. Yet dealerships retain control over financing, trade-ins, and warranty service that most DTC players cannot yet match at scale. Hybrid models emerge: customers configure bikes online, secure financing through OEM portals, then take delivery and service at local dealers. Electric-first entrants exploit DTC to sidestep dealer resistance to new diagnostic investments. Over time, customer experience—not channel identity—will determine share allocation within the dirt bike market.
Geography Analysis
North America generated 35.12% of the global dirt bike market revenue in 2025, driven by mature racing ecosystems, high discretionary income, and federally managed trail systems. California’s phased electric mandate compels OEMs to accelerate zero-emission offerings, reinforcing the region’s role as both demand center and regulatory bellwether. Track closures in suburban corridors slow local growth, yet expansion of state off-highway parks partially offsets access loss. Canada contributes stable spring-to-fall sales that mirror the United States trail preferences, buoyed by provincial trail-pass funding.
Asia-Pacific is the fastest expanding region, scoring a 6.81% CAGR through 2031 as India and China combine rising incomes with policy subsidies to elevate electric two-wheeler adoption. Urbanization fuels demand for short-haul recreation within two hours of major cities, while battery-swap networks in China support day-trip usage without home charging. Southeast Asia follows, albeit from a small base, helped by local assembly incentives and tourism-oriented trail clusters in Indonesia and Thailand. Japan and South Korea remain modest but technology-rich markets that favor high-spec trail and dual-sport machines.
Europe exhibits balanced demand across enduro, dual-sport, and adventure classes, backed by rugged alpine terrain and FIM-sanctioned race calendars. Stricter Euro 5 tailpipe rules and noise caps push OEMs toward smaller displacement and electric powertrains, although fragmented national subsidies create uneven adoption rates. South America leans on value-oriented imports, with Brazil serving as a production hub under its motorcycle industrial policy. Economic volatility tempers unit growth, yet the allure of rainforest and Andean routes sustains aspirational purchases. Middle East and Africa pockets show limited but rising activity in Gulf states and South Africa, constrained mainly by climate and trail access.
Competitive Landscape
The dirt bike market is moderately fragmented. Four Japanese majors—Honda, Yamaha, Kawasaki, Suzuki—collectively hold a major share of global unit volume, while KTM Group (KTM, Husqvarna, GasGas) commands European performance niches. Chinese manufacturers such as CFMoto and Loncin expand export footprints by integrating low-cost lithium iron phosphate batteries that enable sub-USD 5,000 pricing. Electric-only disruptors like Stark Future and CAKE capitalize on silent operation advantages to lobby for access at noise-sensitive suburban tracks, thereby exploiting regulatory gaps that hamper ICE competitors.
Technology rivalry centers on suspension patents, lightweight alloys, and battery management software. Fox Factory’s dual-piston shock and Textron’s magnetorheological damper exemplify supply-chain innovation that gives OEM partners differentiated ride quality. European brands emphasize chromoly frames and tool-less airbox access to speed race-day maintenance. Japanese incumbents defend their share through dense dealer networks and proven resale values. Chinese challengers counter with aggressive DTC pricing and bundled telematics that appeal to cost-conscious buyers.
Strategic moves in 2025–2026 include Ducati unveiling the Desmo450 MX at India’s Supercross League finale, signifying Italian entry into mid-displacement motocross. Yamaha India prepares the WR155 R launch to tap dual-purpose demand. Hero MotoCorp’s Vida sub-brand debuted the Dirt.E K3 youth e-bike, planting a seed in the entry-level electric segment [4]“Vida Dirt.E K3 Launch,” Hero MotoCorp, heromotocorp.com. Kawasaki hinted at reviving two-stroke platforms, acknowledging enthusiast nostalgia and potential lightweight emissions-compliant opportunities.
Dirt Bike Industry Leaders
Yamaha Motor Co., Ltd.
Honda Motor Co., Ltd.
KTM AG
Kawasaki Heavy Industries, Ltd.
Suzuki Motor Corporation
- *Disclaimer: Major Players sorted in no particular order
Recent Industry Developments
- December 2025: Ducati premiered the Desmo450 MX during the Indian Supercross Racing League finale in Calicut and targets a Q1 2026 retail launch in India.
- December 2025: Hero MotoCorp’s Vida division introduced the Dirt.E K3 electric youth motorcycle with an adjustable chassis that scales seat height from 454 mm to 631 mm.
- October 2025: Yamaha India confirmed a Nov 2025 release for the WR155 R dual-purpose model built on its 155 cc liquid-cooled engine platform.
- January 2025: Kawasaki teased a potential revival of two-stroke motocross bikes ahead of AMA Supercross Round 3.
Research Methodology Framework and Report Scope
Market Definitions and Key Coverage
Our study defines the dirt bike market as all brand-new, factory-built off-road motorcycles engineered for rough terrain, covering motocross, enduro, trail, dual-sport, adventure, and youth models powered by internal-combustion or electric drivetrains. Units are tracked at first point of sale, and revenues are expressed in constant 2025 US dollars.
Scope exclusion: Used bikes, pit bikes below 50 cc, spare parts, riding gear, and racetrack services fall outside this market.
Segmentation Overview
- By Type
- Motocross
- Enduro
- Trail
- Dual-Sport
- Adventure
- Mini / Youth
- By Propulsion
- Internal Combustion Engine (ICE)
- Electric
- By Engine Displacement
- Less than and equal to 125 cc
- 126 to 250 cc
- 251 to 500 cc
- More than 500 cc
- By End-User
- Professional (Race Teams)
- Amateur / Recreational
- Commercial (Rental, Industrial, Defense)
- By Price Range
- Low-Cost
- Mid-Range
- Premium
- By Distribution Channel
- Dealerships and Showrooms
- Online Direct-to-Consumer
- Specialty Motorsport Retailers
- By Geography
- North America
- United States
- Canada
- Rest of North America
- South America
- Brazil
- Argentina
- Rest of South America
- Europe
- Germany
- United Kingdom
- France
- Spain
- Russia
- Rest of Europe
- Asia-Pacific
- China
- India
- Japan
- South Korea
- Australia and New Zealand
- Rest of Asia-Pacific
- Middle East and Africa
- Egypt
- Turkey
- Saudi Arabia
- United Arab Emirates
- Rest of the Middle East and Africa
- North America
Detailed Research Methodology and Data Validation
Primary Research
Mordor analysts interviewed OEM sales managers, dealership owners, race organizers, aftermarket importers, and rider clubs across North America, Europe, Asia-Pacific, and Latin America. These discussions verified ASP progression, electric adoption inflection points, and typical replacement cycles, filling gaps left by desk research and letting us triangulate final assumptions.
Desk Research
We began with trade statistics from UN Comtrade and national customs portals, registration data from agencies such as the US Federal Highway Administration and Japan's MLIT, and race participation counts published by the FIM and AMA. Industry white papers and academic journals on power-sports injury rates helped us fine-tune rider cohort sizes. Company filings, investor decks, and price lists supplied average selling prices (ASPs), while news archives on Dow Jones Factiva and vehicle build sheets on Marklines clarified model launches and capacity additions.
To ground regional splits, we cross-checked shipment tallies with tourism board data on off-road holiday bookings and land-use permits for public trails. The sources listed are illustrative; many additional outlets were referenced to collect, validate, and clarify data.
Market-Sizing & Forecasting
A top-down construct converts production and trade data into regional demand pools, which are then benchmarked against registration and competition entry figures; selective bottom-up checks, dealer channel audits, and sampled ASP × unit roll-ups calibrate totals. Key drivers in the model include: 1) annual motocross event entries, 2) 126-250 cc engine output trends, 3) lithium-ion pack cost per kWh, 4) youth participation rates from sports surveys, and 5) trail permit issuance. Multivariate regression links these variables to unit sales, while scenario analysis captures fuel-price shocks and land-access policy swings. Gaps in bottom-up data are bridged using price corridors derived from OEM list-price dispersion and gray-import mark-ups.
Data Validation & Update Cycle
Outputs undergo variance checks against independent indicators, followed by peer review and senior analyst sign-off. We refresh each model annually, issuing interim updates when OEM recalls, regulation changes, or currency moves materially alter the baseline. A final pre-publication sweep ensures clients receive the latest view.
Why Mordor's Dirt Bike Baseline Earns Stakeholder Trust
Published estimates often differ because firms pick unequal scopes, price bases, and refresh schedules. Our disciplined segmentation and yearly rebuild minimize those gaps.
Key gap drivers versus other publishers include inclusion of pit bikes or street-legal dual sports, use of ex-factory versus retail ASPs, single-region extrapolations presented as global totals, and longer refresh cadences that miss fast-moving electric roll-outs.
Benchmark comparison
| Market Size | Anonymized source | Primary gap driver |
|---|---|---|
| USD 9.73 B (2025) | Mordor Intelligence | - |
| USD 11.05 B (2024) | Global Consultancy A | Counts pit and mini bikes; uses retail ASPs; older base year |
| USD 5.70 B (2024) | Regional Consultancy B | Excludes electric models and youth segments; relies on import data from five countries only |
| USD 8.66 B (2025) | Industry Association C | Averages OEM shipment reports without adjusting for inventory carry-over |
Taken together, the comparison shows that by selecting a clear product boundary, validating ASPs through first-hand dealer inputs, and updating every twelve months, Mordor Intelligence delivers a balanced, transparent baseline decision-makers can rely on.
Key Questions Answered in the Report
What is the projected dollar value of the dirt bike market in 2031?
It is forecast to reach USD 13.57 billion by 2031.
How fast is the dirt bike market expected to grow between 2026 and 2031?
The market is set to expand at a 5.70% CAGR over that period.
Which propulsion type is gaining ground most rapidly?
Electric dirt bikes post a 7.12% CAGR through 2031, the fastest among all propulsion categories.
How are online direct-to-consumer (DTC) sales affecting traditional dealerships?
DTC channels grow at 11.24% CAGR, pressuring dealer margins but coexisting through hybrid sales models that mix online configuration with local service.
Which region offers the highest growth rate for dirt bike sales?
Asia-Pacific leads with a 6.81% CAGR, propelled by India, China, and Southeast Asian markets.