Digital Classroom Market Size and Share
Market Overview
| Study Period | 2021 - 2031 |
|---|---|
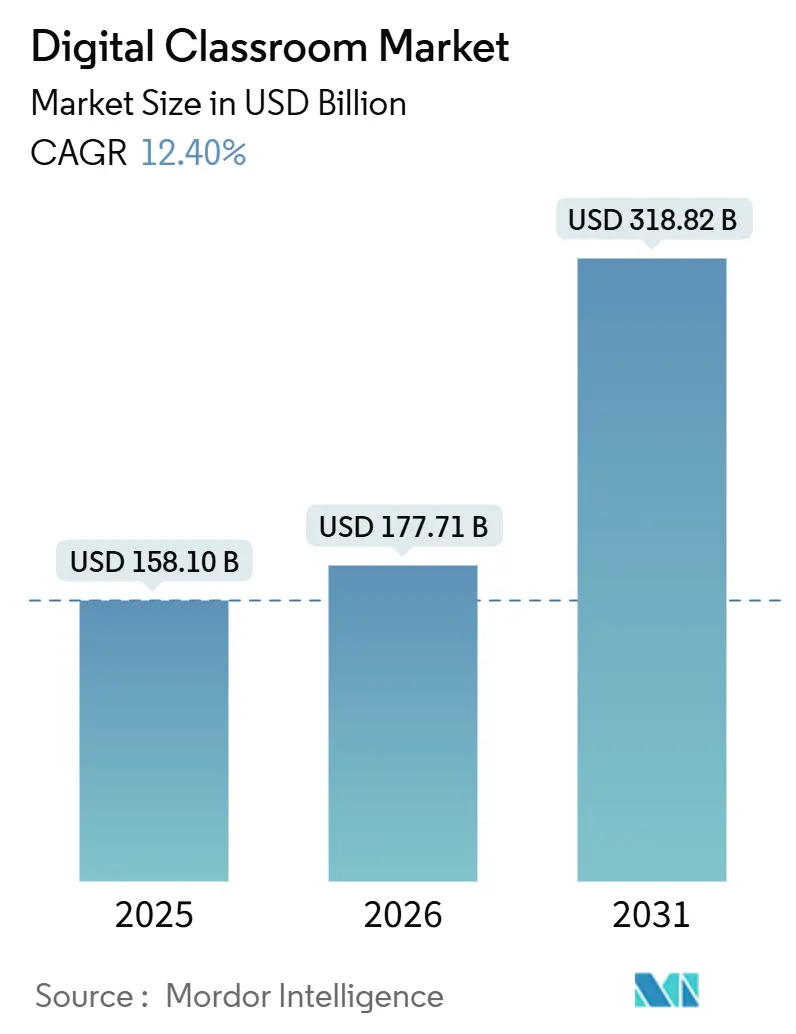
| Market Size (2026) | USD 177.71 Billion |
| Market Size (2031) | USD 318.82 Billion |
| Growth Rate (2026 - 2031) | 12.40% CAGR |
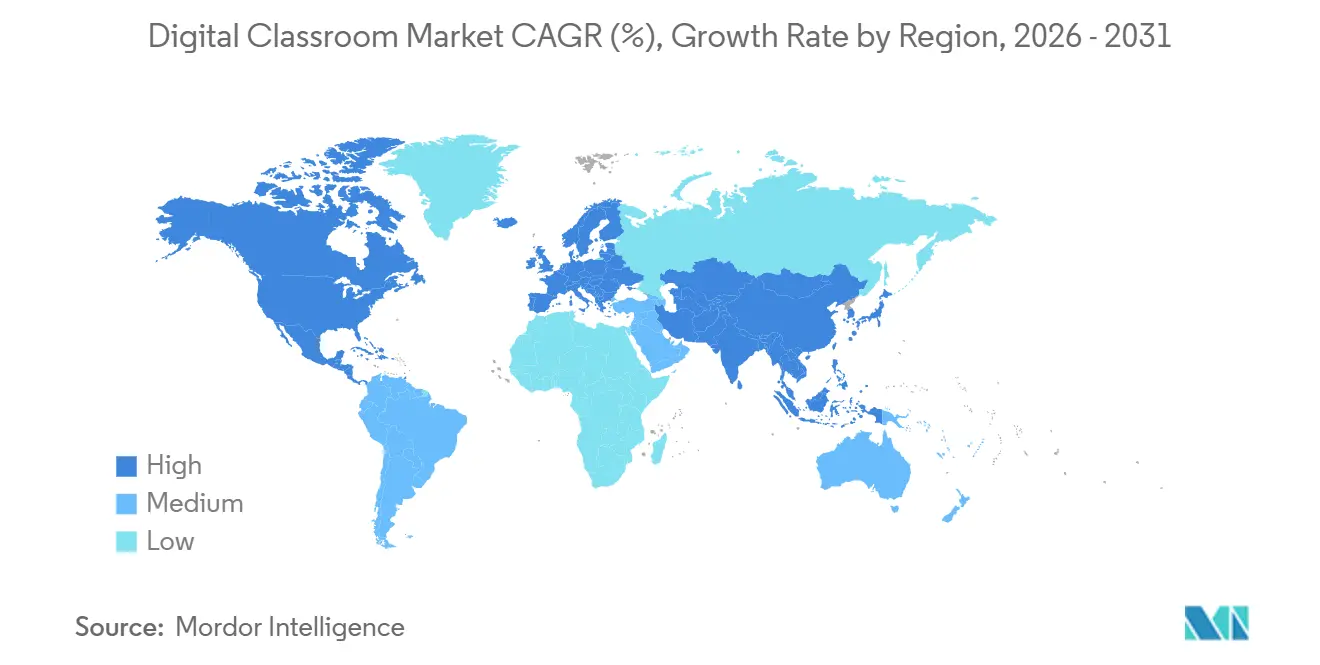
| Fastest Growing Market | Asia Pacific |
| Largest Market | North America |
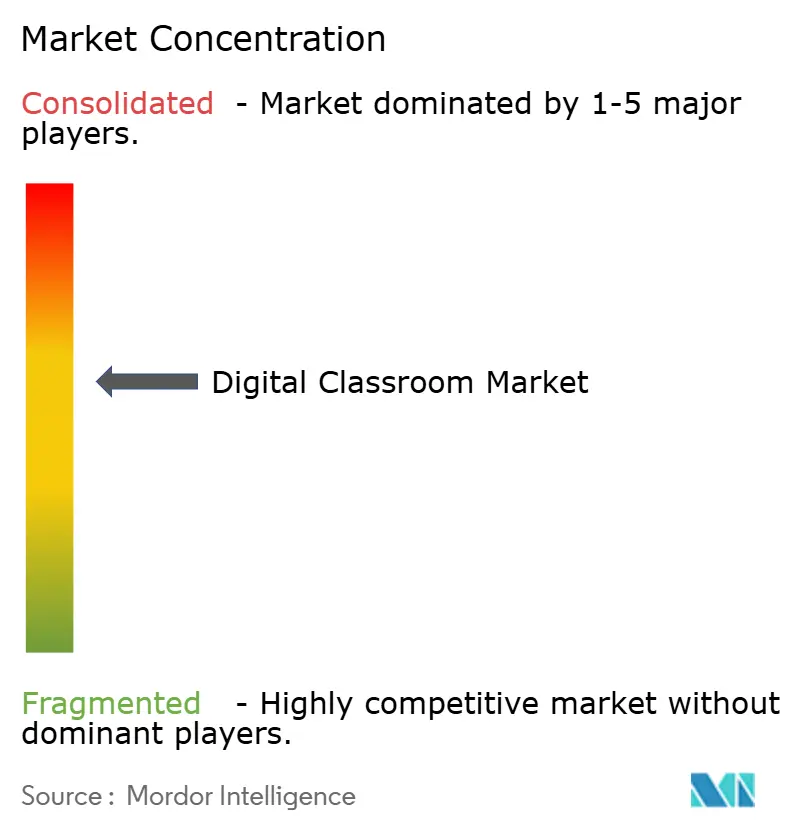
| Market Concentration | Medium |
Major Players *Disclaimer: Major Players sorted in no particular order Image © Mordor Intelligence. Reuse requires attribution under CC BY 4.0. | |
Digital Classroom Market Analysis by Mordor Intelligence
The digital classroom market size is expected to grow from USD 158.1 billion in 2025 to USD 177.71 billion in 2026 and is forecast to reach USD 318.82 billion by 2031 at a 12.40% CAGR over 2026-2031. North America accounted for a 62.21% market share in 2025, while Asia-Pacific is expected to grow at a 17.52% CAGR from 2026 to 2031. Growth is driven by government investments and increased cloud adoption among large learner populations. Institutions are adopting cloud-native platforms, compliance-ready governance, and durable devices, shifting to platform-centric models. Regulatory frameworks like FERPA and GDPR influence procurement, emphasizing auditability, identity management, and data minimization. Consolidation is evident with Instructure’s USD 4.8 billion acquisition in 2024, aimed at enhancing product innovation and scaling global operations in the digital classroom market.
Key Report Takeaways
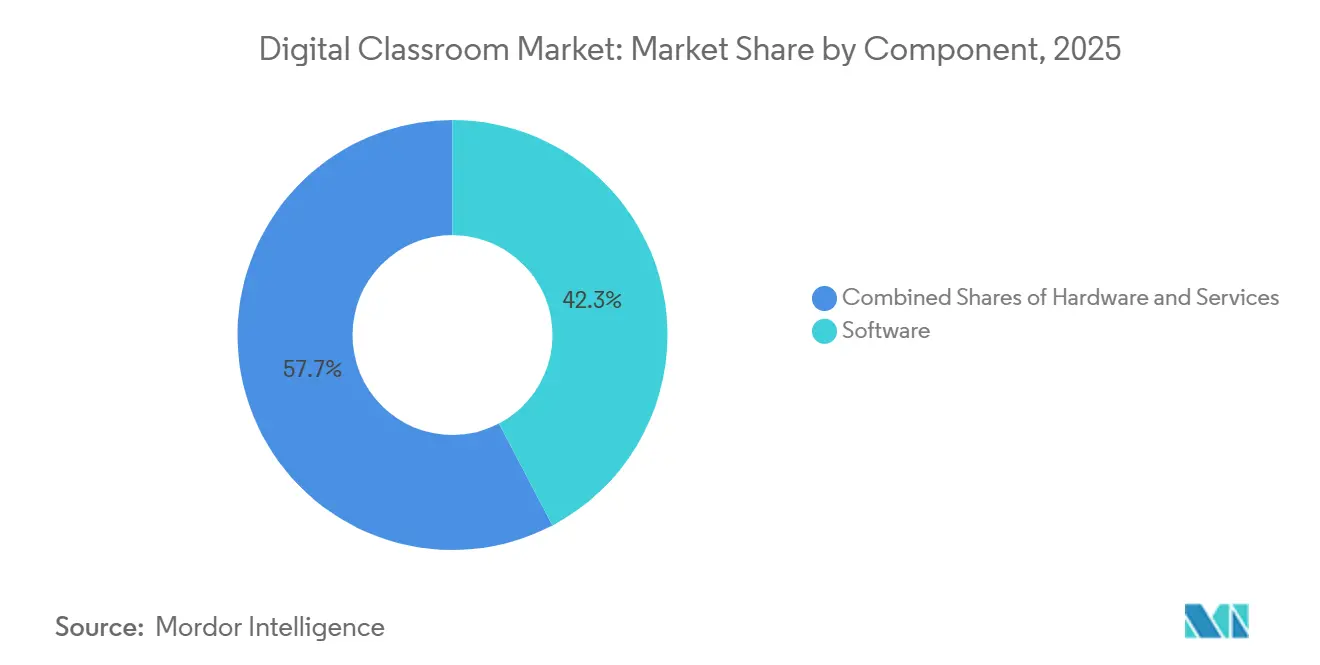
- By component, software led with a 42.31% revenue share in the Digital Classroom Market in 2025, while VR or AR headsets are projected as the fastest‑growing hardware subsegment at a 19.56% CAGR through 2031.
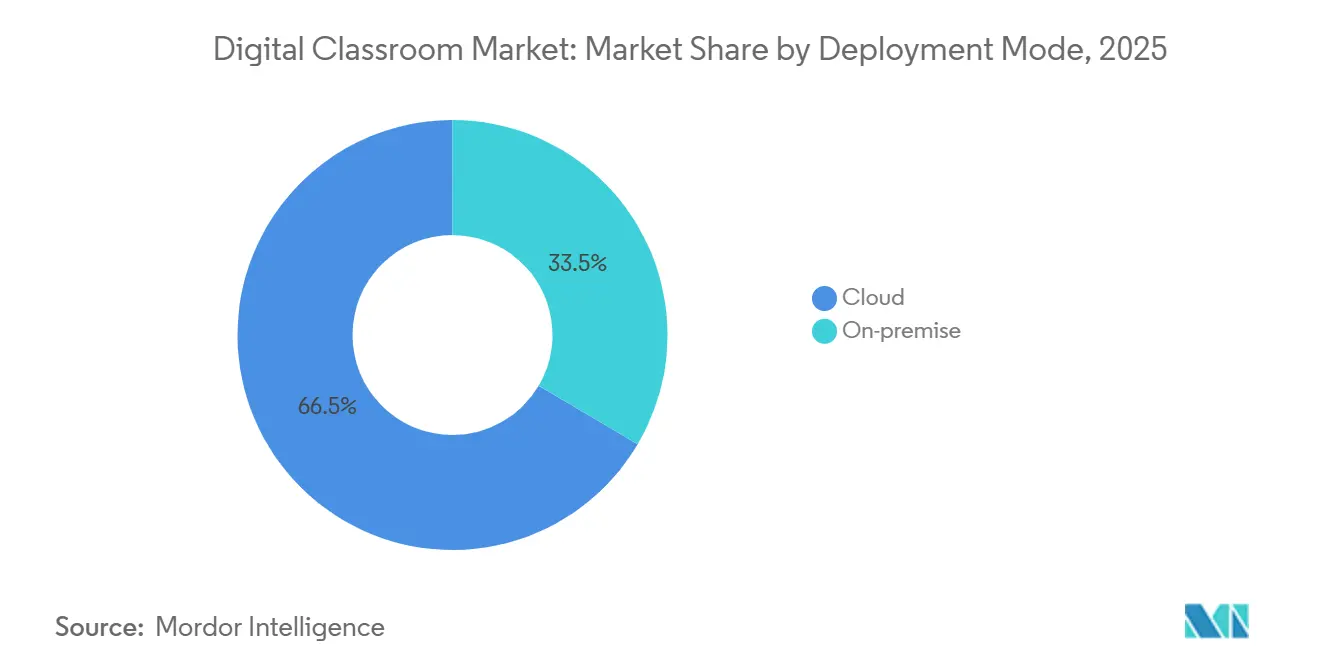
- By deployment mode, cloud captured 66.52% share in the Digital Classroom Market in 2025, while hybrid platforms are set for the highest expansion at a 17.89% CAGR through 2031.
- By end user, K‑12 schools accounted for 43.31% of spending in the Digital Classroom Market in 2025, while corporate and professional training is projected as the fastest‑growing at a 16.32% CAGR through 2031.
- By geography, North America held 62.21% of the Digital Classroom Market in 2025, while Asia‑Pacific is forecast as the fastest‑growing region at a 17.52% CAGR through 2031.
Note: Market size and forecast figures in this report are generated using Mordor Intelligence’s proprietary estimation framework, updated with the latest available data and insights as of January 2026.
Global Digital Classroom Market Trends and Insights
Drivers Impact Analysis
| Drivers | (~) % Impact on CAGR Forecast | Geographic Relevance | Impact Timeline |
|---|---|---|---|
| Broadband expansion and affordable devices are widening access to the Digital Classroom Market | +1.8% | Global, with early gains in North America, the European Union, and the Asia-Pacific urban centers | Medium term (2-4 years) |
| Government investment in digital learning is accelerating adoption across education systems | +2.1% | Asia-Pacific core (India, China), spill-over to Latin America and Sub-Saharan Africa | Long term (≥ 4 years) |
| Cloud‑native LMS ecosystems are scaling rapidly, enhancing integration and flexibility | +1.6% | North America, the European Union, with rapid adoption in APAC | Short term (≤ 2 years) |
| AI‑driven personalized learning analytics are improving engagement and learning outcomes | +1.9% | North America and the European Union lead, scaling in Asia-Pacific and the Middle East | Medium term (2-4 years) |
| Device‑as‑a‑Service models are simplifying procurement for K‑12 institutions | +1.2% | North America, with pilot programs in select European Union and APAC districts | Short term (≤ 2 years) |
| Low‑orbit satellite connectivity is enabling digital classrooms in remote and underserved schools | +1.4% | Sub-Saharan Africa, Latin America, rural Asia, with pilot deployments in North America | Long term (≥ 4 years) |
| Source: Mordor Intelligence | |||
Broadband expansion and affordable devices are widening access to the Digital Classroom Market
The digital classroom market is growing due to affordable, cloud-optimized devices and improved connectivity across regions and income levels. Districts now prefer rolling refresh schedules over bulk purchases to ensure predictable budgeting and avoid disruptions caused by simultaneous device end-of-life events. Google's extended ChromeOS support helps reduce total ownership costs while maintaining security and manageability. Low Earth orbit satellites are expanding coverage to remote schools, offering bandwidth and latency suitable for real-time instruction and cloud collaboration. Interactive displays with AI features enable live collaboration, transcription, and content search, enhancing the functionality of connected classrooms. Improved connectivity and device reliability support hybrid usage models, ensuring continuity even during infrastructure limitations or maintenance. These advancements are transforming classrooms into dynamic, collaborative environments that meet modern educational needs[1]Samsung Newsroom, “Samsung Brings New AI Power to Its Interactive Display at BETT 2025,” Samsung, news.samsung.com.
Government investment in digital learning is accelerating adoption across education systems
Government programs are accelerating the shift to digital platforms and content, supporting investments and teacher training in the digital classroom market. The United States Department of Education allocated USD 169 million in FIPSE awards in January 2026, with USD 50 million directed toward AI initiatives to improve instruction and outcomes[2]U.S. Department of Education, “U.S. Department of Education Announces Release of $169 Million Under Fund for Improvement of Postsecondary Education,” U.S. Department of Education, ed.gov. FY25 grant withholdings in key K-12 programs redirected focus to essential platforms and compliance services, while higher education investments prioritized AI. The European Union’s Digital Education Action Plan (2027) targets digital skills, educator training, and infrastructure, aiming for 80% of citizens to achieve basic digital skills by 2030. India’s policies, backed by budget allocations, expand access to devices, content, and training aligned with new competency goals. UNESCO’s initiatives promote global knowledge-sharing, reducing duplication, and supporting scalable policy and platform models.
Cloud‑native LMS ecosystems are scaling rapidly, enhancing integration and flexibility
Cloud-native LMS platforms are now central to instruction and student lifecycle management as institutions move from server ownership to subscription models in the digital classroom market. Canvas supports approximately 200 million learners in over 100 countries. Its take-private transaction by KKR and Dragoneer in 2024 aims to accelerate investment and international growth. PowerSchool serves over 50 million students with a unified SIS, LMS, and ERP suite, enabling district-level analytics and early-warning capabilities. Large organizations adopt hybrid architectures to balance data residency, latency, and AI-enabled services, supported by management planes spanning on-premises and multi-cloud assets. Vendors report improved security with cloud migration, though misconfiguration remains a key issue, emphasizing governance and role clarity. These trends drive platform consolidation around extensible LMS backbones that support identity management, content standards, and continuous analytics feedback.
AI‑driven personalized learning analytics are improving engagement and learning outcomes
AI capabilities are advancing from pilots to production as institutions integrate tools for personalized learning, automated assessments, and proactive interventions in the digital classroom market. Vendor data shows organizations using AI in learning systems achieve better training outcomes and learner retention, while educators save time on routine tasks. District analytics now combine attendance, assessments, and social-emotional data to identify risks and provide tiered support, aligning with multi-tiered systems of support frameworks. Policy changes, including COPPA updates in 2025, have increased requirements for parental consent, data retention, and biometric data handling, influencing platform designs and strategies. International networks emphasize AI literacy and responsible-use frameworks to enhance teacher expertise, with professional development central to sustainable adoption. Procurement increasingly favors vendors offering privacy-by-design, audit-ready documentation, and transparent governance for continuous improvement[3]Federal Register, “Children’s Online Privacy Protection Rule,” Federal Register, federalregister.gov.
Restraints Impact Analysis
| Restraints | (~) % Impact on CAGR Forecast | Geographic Relevance | Impact Timeline |
|---|---|---|---|
| Funding challenges from the post‑ESSER budget cliff in the United States K‑12 are limiting sustained investment in digital learning | -0.9% | North America, with spillover effects on vendors serving global markets | Short term (≤ 2 years) |
| The digital‑skills gap among teachers is slowing the effective integration of classroom technologies | -0.6% | Global, with acute challenges in rural European Union, Latin America, and Sub-Saharan Africa | Medium term (2-4 years) |
| Stricter data‑privacy regulations are adding compliance burdens for education platforms | -0.4% | European Union (GDPR enforcement), United States (state-level children’s privacy laws), China (PIPL) | Long term (≥ 4 years) |
| Sustainability pressures tied to e‑waste are complicating hardware refresh cycles in schools | -0.3% | European Union (Right to Repair mandates), North America (institutional ESG commitments) | Medium term (2-4 years) |
| Source: Mordor Intelligence | |||
Funding challenges from the post‑ESSER budget cliff in the United States K‑12 are limiting sustained investment in digital learning
The expiration of ESSER funding tightened discretionary budgets for districts, increasing scrutiny on renewing supplemental tools in the digital classroom market. Federal withholdings from Title I-C, Title II-A, and Title IV-B grants in FY25 totaled nearly USD 7 billion, driving a shift toward essential platforms, multi-year contracts, and stricter procurement criteria. Illinois districts reported nearly full utilization of relief funds, while Chicago Public Schools faced a 2026 budget deficit, leading to staffing cuts and operational changes. Core systems like LMS, SIS, and identity services, critical for compliance and daily operations, remain more resilient than discretionary contracts. Aging pandemic-era devices add pressure on hardware replacement cycles, prompting rolling refreshes and stricter lifecycle management. Vendors offering measurable efficiency gains, compliance documentation, and stable integration roadmaps are better positioned to retain accounts.
The digital‑skills gap among teachers is slowing the effective integration of classroom technologies
Uneven teacher readiness to adopt digital tools slows transformation in the digital classroom market. The European Commission links digital competencies to long-term competitiveness, targeting basic digital skills adoption by 2030. This highlights the challenge and the need for teacher support. European Schoolnet’s Future Classroom Lab promotes professional development through hybrid workshops and shared resources adaptable to local contexts. International networks stress that AI should enhance teaching, with training focusing on pedagogy, ethics, and oversight alongside tool operation. National budgets and public programs prioritize capacity-building for educators, though connectivity and device limitations in rural or under-resourced schools hinder practical application. Investments in infrastructure and aligned training improve adoption rates, but ongoing coaching and time for experimentation remain critical for sustained progress in the digital classroom market.
Segment Analysis
By Component: Software Anchors Revenue, VR or AR Leads Growth
Software accounted for 42.31% of the digital classroom market share in 2025, driven by the adoption of cloud learning platforms, collaboration tools, and analytics for managing instruction and student operations. The industry has shifted to integrated solutions combining LMS, SIS, and ERP systems, reducing administrative tasks and improving analytics. Canvas, serving 200 million learners globally, transitioned to private ownership in 2024 to accelerate product development and expand its global reach. PowerSchool supports over 50 million students, showcasing the benefits of a unified platform for attendance, assessment, and intervention planning. These trends emphasize procurement strategies that reduce vendor diversity, prioritize privacy, and establish a foundation for analytics and AI in digital classrooms[4]ListedTech, “K 12 Dual LMS Adoption: Bridging Dual LMS Adoption and Integration,” ListedTech, listedtech.com.
VR and AR headsets are the fastest-growing hardware subsegment, with a projected 19.56% CAGR through 2031, driven by immersive simulations in labs, healthcare, and vocational training. Improved alignment between content, curriculum, and assessment supports this growth. Interactive displays are evolving into AI-enabled collaboration hubs with features like real-time summarization and transcript capture. Shipment trends indicate a preference for larger formats and shared digital canvases. Device strategies now focus on repairability, extended battery life, and fleet management to minimize downtime and stabilize costs in the digital classroom market.
Note: Segment shares of all individual segments available upon report purchase
By Deployment Mode: Cloud Dominance, Hybrid Platforms, Fastest Growth
Cloud-based deployment models accounted for 66.52% of the digital classroom market share in 2025 as institutions shifted from server ownership to subscription services. These services centralize updates, scale elastically, and enhance resilience. The digital classroom industry is moving toward architectures that simplify identity and content standards while enabling analytics and AI integration in teaching and operations. Hybrid platforms, balancing data residency controls with access to public cloud AI services and global content delivery networks, are projected to grow at a 17.89% CAGR through 2031. Unified management planes across hybrid and multi-cloud environments reduce operational complexity for education IT teams and streamline governance and compliance workflows. Procurement trends favor ecosystems with strong SLAs, endpoint security, and deep integration options in the digital classroom market.
Security and regulatory requirements influence deployment decisions as institutions address residency, consent, retention, and audit obligations. Cloud migration enhances security for many schools, though misconfiguration remains a key vulnerability, necessitating defined roles and controls. Edge nodes and global interconnects reduce latency for synchronous instruction and media delivery, expanding cloud-hosted use cases for live classrooms. Privacy frameworks drive demand for regional hosting, detailed audit trails, and granular permissions, especially for AI applications processing student data. The hybrid model segment of the digital classroom market is expected to grow at a 17.89% CAGR through 2031 as districts adopt mixed architectures for sensitive records and high-availability content services.
Note: Segment shares of all individual segments available upon report purchase
By End User: K-12 Dominates Share, Corporate Training Fastest Growth
K-12 schools represented 43.31% of spending in the digital classroom market in 2025, driven by the adoption of 1-to-1 device programs, cloud platform standardization, and hybrid learning options. The industry reflects this shift with integrated tools for instruction, assessment, attendance, and communication. Budget constraints in some districts have prioritized essential platforms with compliance benefits and reduced vendor overlap for better manageability. National programs are enhancing digital content, teacher training, and infrastructure, supporting competency-based approaches. Public digital learning initiatives are improving content access and promoting technical standards for easier integration across ministries and districts.
Corporate and professional training is the fastest-growing segment, with a 16.32% CAGR projected through 2031. Workforce transformation, AI literacy, and competency-based learning tied to performance outcomes are driving this growth. Universities, nonprofits, and government agencies are investing in cloud platforms and analytics to improve student success, compliance training, and citizen learning. Buyers prioritize measurable outcomes, quick implementation, and strong privacy measures, increasing demand for vendors with advanced analytics and governance. Public agencies and NGOs are expanding platform access to foster inclusion and scalable delivery models. The sector is evolving, with formal education and lifelong learning converging in credentialing, analytics, and content strategies focused on demonstrable skills.
Geography Analysis
North America held a 62.21% share of the digital classroom market in 2025, supported by advanced IT infrastructure, stable platform partnerships, and high per-student technology investments. Districts addressed the ESSER expiration by focusing on essential platforms and vendor consolidation, which increased switching costs and benefited providers with strong compliance and identity integrations. Federal support for higher education technology continues, with FIPSE grants in 2026 allocating USD 50 million to AI initiatives aimed at improving teaching and learning in key disciplines. Canvas and PowerSchool remain central to instruction and student operations, with multi-year agreements ensuring market stability. Regulatory compliance, such as FERPA, influences vendor selection and data management, driving demand for audit-ready documentation and robust privacy controls.
Asia-Pacific is expected to grow at a 17.52% CAGR from 2026 to 2031, driven by national digital education plans that accelerate the adoption of devices, platforms, and skills. India emphasizes digital infrastructure and competency-building across its extensive school systems, aligning with national policy and budget priorities. The region’s market growth is supported by centralized procurement and increasing mobile-first learning behaviors. In China, centralized classroom digitization and coordinated procurement in education technology are shaping domestic vendor shares and supply chains. These efforts enhance scale effects in devices, content, and analytics, aligning with AI-enabled learning objectives.
Europe combines modernization with strict privacy and security enforcement, emphasizing hybrid architecture and European Union-hosted services. The European Union's Digital Education Plan sets 2030 skill targets and promotes teacher training and school capacity building. Cross-border networks facilitate the sharing of scalable tools and practices. European School net initiatives demonstrate how hybrid professional development enhances classroom practices as schools adopt analytics and adaptive learning. In remote areas, satellite and edge services complement fiber expansions, ensuring consistent access and mitigating last-mile challenges. These factors drive steady procurement of platforms and services aligned with instructional and regulatory needs.
Competitive Landscape
Large platform vendors, cloud providers, and device makers significantly influence the installed base and procurement priorities in the digital classroom market. Instructure's Canvas supports approximately 200 million learners and is positioned for innovation and international growth under private ownership. PowerSchool's integrated SIS, LMS, and ERP suite serves over 50 million students globally, demonstrating how integrated workflows enhance district-level analytics and intervention planning. Deeper integration of identity, content, analytics, and student records increases switching costs, encouraging multi-year contracts and renewal stability. Buyers focus on measurable learning outcomes, privacy, and ecosystem interoperability to reduce risks and ensure long-term value.
Hardware strategies emphasize durability, manageability, and total cost of ownership as schools aim for stable device fleets. Dell’s 2026 education PCs feature rugged designs, replaceable components, and extended battery life to minimize downtime and repair needs. Interactive display manufacturers incorporate AI for search, summarization, and live transcription, transforming displays into collaborative tools integrated with LMS and productivity suites. Device and display procurement aligns with multi-year budgets, with service programs, warranties, and training support influencing renewal decisions. As classrooms blend in-person and remote learning, performance, reliability, and app ecosystems outweigh panel specifications in determining utility.
Cloud services and compliance remain critical as schools evaluate data residency, consent, retention, and auditing capabilities. Azure for Education supports unified management across on-premises and multi-cloud environments, aiding governance and compliance with residency and reporting requirements. Privacy regulations shape contracts and solutions, with COPPA updates in 2025 expanding consent and retention standards, while FERPA continues to guide data practices. Misconfigurations highlight the need for vendor guidance, role-based access, and continuous monitoring. Connectivity improvements through satellite and edge services complement terrestrial networks, ensuring uninterrupted synchronous learning and supporting equitable access initiatives.
Digital Classroom Industry Leaders
Google LLC
Microsoft Corporation
Apple Inc.
Instructure Inc. (Canvas)
Blackboard Inc.
- *Disclaimer: Major Players sorted in no particular order
Recent Industry Developments
- January 2026: The United States Department of Education announced USD 169 million in FIPSE awards, allocating USD 50 million to support AI-focused teaching and learning projects in postsecondary education programs.
- January 2026: Samsung presented its AI-enabled interactive displays at Bett 2026, focusing on connected learning experiences designed to improve classroom collaboration.
- January 2026: Dell introduced Education PCs and programs designed for classrooms, emphasizing rugged design, all-day battery life, and customer-replaceable parts. These features aim to lower ownership costs and improve uptime.
- December 2025: Coursera announced a USD 2.5 billion all-stock acquisition of Udemy, marking a major consolidation in the EdTech sector. The combined platform will serve over 270 million learners and nearly 19,000 enterprise customers globally, highlighting a significant shift in online education.
Research Methodology Framework and Report Scope
Market Definitions and Key Coverage
Our study defines the digital classroom market as the aggregated global spending on hardware (interactive flat-panel displays, laptops or Chromebooks, tablets, VR/AR headsets, classroom robotics), software platforms (learning-management systems, collaboration suites, proctoring and content-authoring tools), and related integration or training services that enable technology-rich, in-person, remote, or hybrid instruction across K-12 schools, higher-education institutions, corporate and government training environments.
Scope exclusion: stand-alone consumer e-learning subscriptions and generic personal-device sales that are not procured for instructional use are kept outside the boundary.
Segmentation Overview
- By Component (Value)
- Hardware
- Interactive Flat-Panel Displays
- Laptops and Chromebooks
- Tablets
- VR/AR Headsets
- Classroom Robotics
- Software
- Learning Management Systems
- Classroom Collaboration Tools
- Assessment and Proctoring Platforms
- Content Authoring and Digital Curriculum
- Classroom Management Software
- Services
- Hardware
- By Deployment Mode
- Cloud
- On-premise
- By End-user
- K-12 Schools
- Higher Education
- Corporate and Professional Training
- Government and Non-profit
- By Geography
- North America
- Canada
- United States
- Mexico
- South America
- Brazil
- Peru
- Chile
- Argentina
- Rest of South America
- Asia-Pacific
- India
- China
- Japan
- Australia
- South Korea
- South East Asia (Singapore, Malaysia, Thailand, Indonesia, Vietnam, and Philippines)
- Rest of Asia-Pacific
- Europe
- United Kingdom
- Germany
- France
- Spain
- Italy
- BENELUX (Belgium, Netherlands, and Luxembourg)
- NORDICS (Denmark, Finland, Iceland, Norway, and Sweden)
- Rest of Europe
- Middle East And Africa
- United Arab of Emirates
- Saudi Arabia
- South Africa
- Nigeria
- Rest of Middle East And Africa
- North America
Detailed Research Methodology and Data Validation
Primary Research
Mordor analysts complemented desk findings through structured interviews with ed-tech vendors, district technology directors, university CIOs, and regional channel partners across North America, Europe, Asia-Pacific, and Latin America. These interactions clarified adoption hurdles, pricing dispersion, and refresh cycles, letting us refine penetration and utilization assumptions before finalizing the model.
Desk Research
We first assembled baseline indicators from open sources such as UNESCO Institute for Statistics enrollments, World Bank broadband and GDP series, national education-technology grant disclosures (for example, U.S. ESSER funds or India's DIKSHA dashboard), and trade association shipment reports for interactive displays and tablets. Company filings, investor presentations, and reputable press releases were screened to capture average selling prices, installed-base upgrades, and cloud-license renewals. Subscription resources inside Mordor, including D&B Hoovers for vendor financials and Dow Jones Factiva for deal news, helped cross-check revenue splits. This list is illustrative; many additional materials informed our desk work.
Market-Sizing & Forecasting
A calibrated top-down model starts with student and employee learner pools by region, layers device-to-learner penetration ratios, classroom software seat factors, and typical license or hardware ASPs, and is then reconciled with bottom-up snapshots from supplier revenue roll-ups and channel checks. Key variables like government ICT budgets, cloud-migration rates, replacement intervals, and hybrid-learning share drive both the 2025 baseline and scenario envelopes. Multivariate regression, supplemented by ARIMA smoothing where historic time series permit, projects each variable through 2030, and gap-filled bottoms-up estimates are scaled to align within an accepted variance band.
Data Validation & Update Cycle
Outputs pass a three-stage review: automated anomaly flags, senior-analyst sense-checks, and a pre-publication refresh. Our models are revisited annually, with interim tweaks when major funding programs, regulatory changes, or material corporate disclosures emerge.
Why Mordor's Digital Classroom Baseline Earns Trust
Published estimates often diverge because different firms choose dissimilar product mixes, user cohorts, and currency bases.
Key gap drivers include whether services revenue is counted, if corporate training spend is bundled, exchange-rate timing, and the cadence at which underlying ASPs are refreshed.
Benchmark comparison
| Market Size | Anonymized source | Primary gap driver |
|---|---|---|
| USD 177.71 B (2025) | Mordor Intelligence | - |
| USD 207.32 B (2025) | Global Consultancy A | Includes enterprise software suites and bulk PC replacements not earmarked for instruction |
| USD 15.19 B (2024) | Regional Consultancy B | Captures only hardware, omits cloud software and service contracts |
| USD 172.37 B (2025) | Trade Journal C | Excludes on-premise learning-management renewals and minor geography set |
Taken together, the comparison shows that Mordor's disciplined scope selection, blended top-down/bottom-up math, and annual refresh cycle provide a balanced, transparent baseline that decision-makers can trace back to clearly stated variables and reproducible steps.
Key Questions Answered in the Report
What is the size of the digital classroom market in 2026, and how fast is it growing to 2031?
The digital classroom market size is USD 177.71 billion in 2026 and is forecast to reach USD 318.82 billion by 2031 at a 12.40% CAGR over 2026-2031.
Which region currently leads and which grows fastest over the forecast?
North America led with a 62.21% share in 2025, while Asia-Pacific is projected as the fastest-growing at a 17.52% CAGR from 2026 to 2031.
Which components are most influential in current deployments?
Software leads revenue with a 42.31% share, while VR or AR headsets are the fastest-growing hardware subsegment at a 19.56% CAGR through 2031.
What deployment model dominates education technology today?
Cloud deployment captured 66.52% share in 2025, and hybrid platforms are growing the fastest at a 17.89% CAGR through 2031 as schools balance scalability with data residency.
Who are notable platform vendors shaping institutional adoption?
Canvas by Instructure supports around 200 million learners, and PowerSchool serves more than 50 million students, reflecting strong installed bases and integrated data workflows.
What policy shifts are most relevant to classroom technology decisions?
COPPA updates in 2025 strengthened consent and data retention rules, and FERPA-aligned governance continues to drive contracts, design choices, and audit requirements for schools.


