Market Overview
| Study Period | 2020 - 2031 |
|---|---|
| Forecast Data Period | 2026 - 2031 |
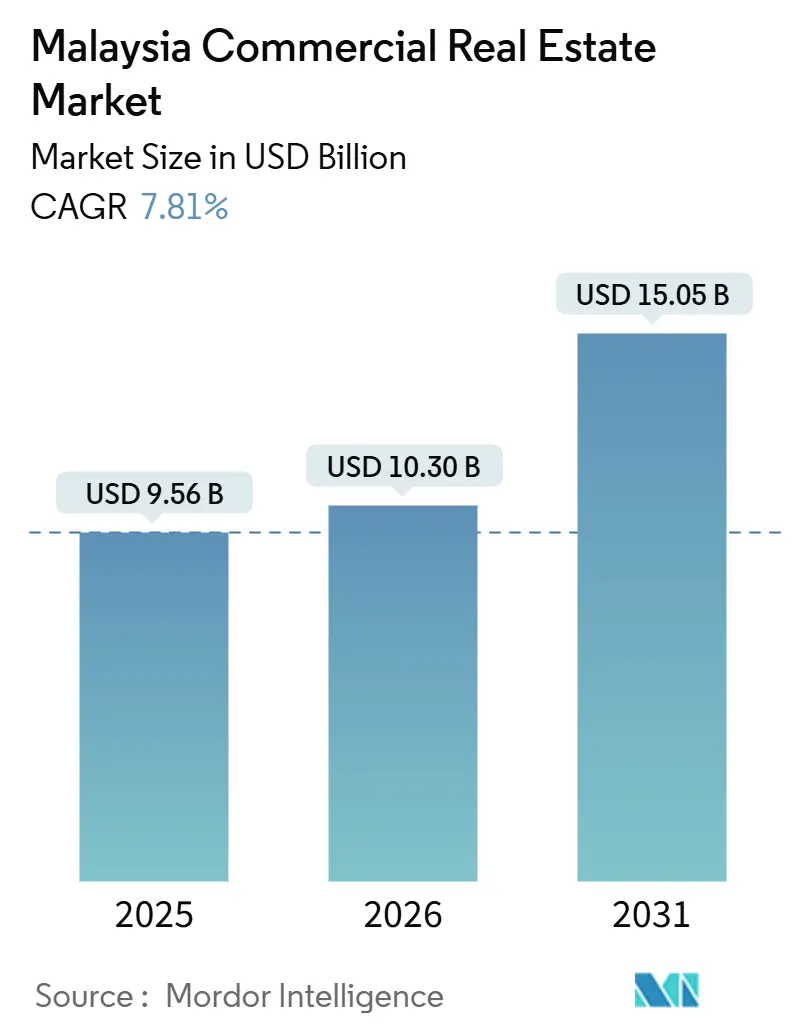
| Base Year Market Size (2025) | USD 9.56 Billion |
| Market Size (2026) | USD 10.30 Billion |
| Market Size (2031) | USD 15.05 Billion |
| Growth Rate (2026 - 2031) | 7.81% CAGR |
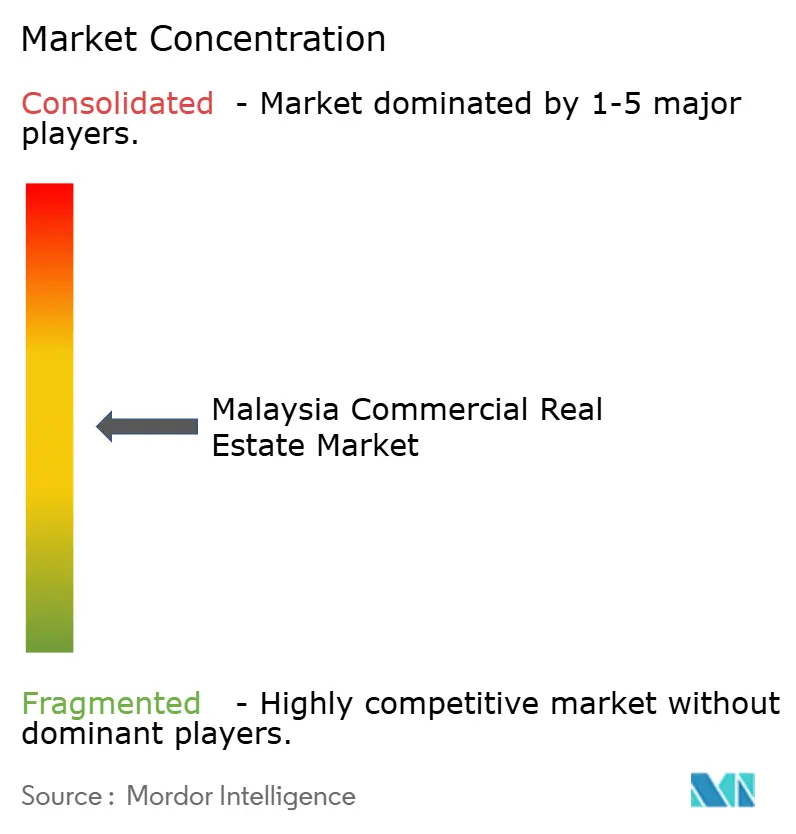
| Market Concentration | Medium |
Major Players *Disclaimer: Major Players sorted in no particular order Image © Mordor Intelligence. Reuse requires attribution under CC BY 4.0. | |
Malaysia Commercial Real Estate Market Analysis by Mordor Intelligence
The Malaysia commercial real estate market size is projected to expand from USD 9.56 billion in 2025 and USD 10.30 billion in 2026 to USD 15.05 billion by 2031, registering a CAGR of 7.81% between 2026 to 2031. Demand is shifting from speculative condominiums toward income-producing space as the Johor–Singapore Special Economic Zone offers a 5% corporate tax rate for 15 years, large manufacturers commit USD 94.8 billion of foreign direct investment, and e-commerce gross merchandise value rises from USD 20 billion in 2025 toward USD 29 billion by 2030. Kuala Lumpur’s legacy offices struggle with 18.6% city-core vacancy, yet WELL-certified towers in Tun Razak Exchange remain above 85% occupancy, reflecting a bifurcation that is nudging capital toward green retrofits. Industrial vacancy tightened to 2.0% in 2Q 2025 as third-party logistics tenants pre-leased 2.1 million square feet, while land within 500 meters of the Rapid Transit System Link’s Bukit Chagar station jumped to USD 222–333 per square foot, drawing mixed-use developers. Rising construction costs, led by USD 5.46 cement bags and a Rider Levett Bucknall tender index that gained 2.9% year on year in 1Q 2025, reinforce corporate preference for rent over ownership, lifting the rental segment’s share of the Malaysia commercial real estate market.
Key Report Takeaways
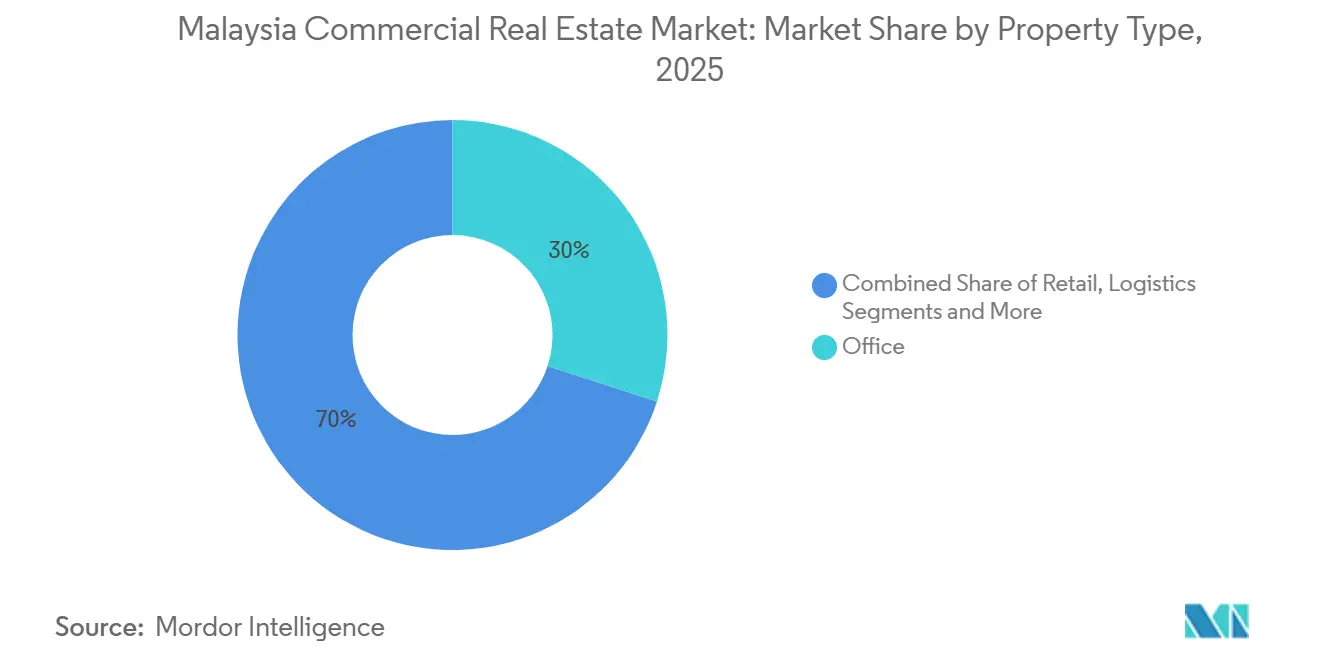
- By property type, office held 30% of the Malaysia commercial real estate market share in 2025; logistics space is forecast to expand at an 11.20% CAGR through 2031.
- By business model, rental transactions captured 63% of the Malaysia commercial real estate market size in 2025, while the same segment is also projected to lead with an 8.33% CAGR through 2031.
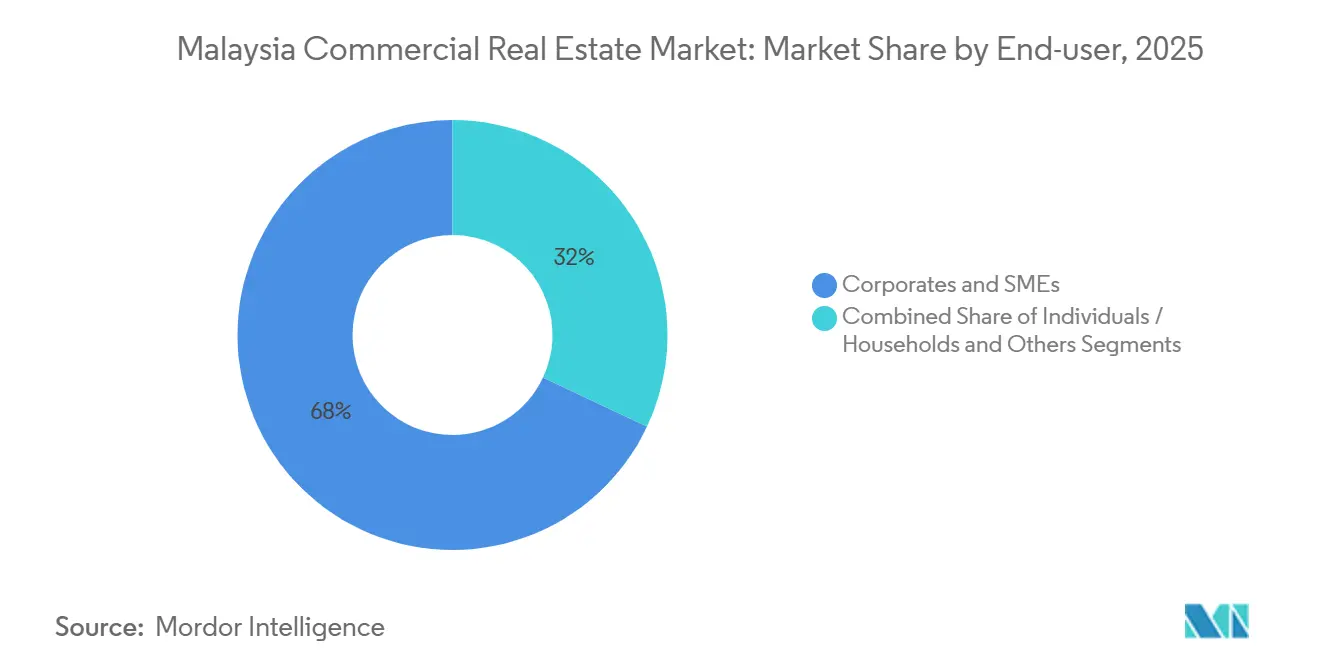
- By end-user, corporates and SMEs commanded 68% share in 2025, whereas individuals and households are set to advance at an 8.40% CAGR between 2026-2031.
- By geography, Kuala Lumpur led with a 41% share in 2025; Johor Bahru is expected to post the fastest 10.4% CAGR to 2031.
Note: Market size and forecast figures in this report are generated using Mordor Intelligence’s proprietary estimation framework, updated with the latest available data and insights as of 2026.
Malaysia Commercial Real Estate Market Trends and Insights
Drivers Impact Analysis*
| Drivers | (~) % Impact on CAGR Forecast | Geographic Relevance | Impact Timeline |
|---|---|---|---|
| Record manufacturing and digital FDI fueling industrial and logistics uptake | +2.1% | Penang, Johor Bahru, Selangor | Short term (≤ 2 years) |
| Mega-infrastructure completions catalyzing transit-oriented developments | +1.8% | Johor Bahru, Kuala Lumpur, Penang | Medium term (2-4 years) |
| E-commerce-led last-mile logistics and dark-store demand surge | +1.6% | Klang Valley, Johor Bahru, Penang | Short term (≤ 2 years) |
| Johor–Singapore SEZ early-bird incentives sparking cross-border relocations | +1.5% | Johor Bahru | Medium term (2-4 years) |
| Flight-to-quality and ESG demand for Grade-A, green, WELL-certified offices | +1.4% | Kuala Lumpur, Petaling Jaya | Medium term (2-4 years) |
| REIT-driven strata break-up unlocking affordable fractional ownership | +0.9% | National | Long term (≥ 4 years) |
| Source: Mordor Intelligence | |||
Record Manufacturing and Digital FDI Fueling Industrial and Logistics Uptake
Malaysia approved USD 94.8 billion of FDI in 2025, 11% above 2024, with Penang attracting USD 5 billion for chip and electronics expansion. Industrial vacancy dipped from 3.9% to 2.0% in a single quarter as 2.1 million square feet of Grade-A sheds were absorbed[1]JLL Malaysia, “Malaysia Office Market Overview Q4 2025,” jll.com.my. Third-party logistics groups lease 49% of prime floor area, contrasting with e-tailers’ 6% slice, which indicates deeper outsourcing of fulfillment. Penang land now costs USD 14–19 per square foot, yet multinationals sign 10-15 year leases that escalate 2–3% annually, locking predictable cash flows for REIT buyers like Axis. Sale-leasebacks, exemplified by a USD 178 million Seberang Perai deal, continue to convert fixed assets into capex budgets for manufacturers.
Mega-infrastructure completions catalyzing transit-oriented developments
The Rapid Transit System Link reached 65% completion in November 2025, with trial runs slated for July 2026. Land within a 500 meter radius of Bukit Chagar appreciated 43–114% over three years, drawing offices, hotels, and malls into vertically integrated precincts. Penang’s USD 0.95 billion Straits City, anchored by a 343-room Crowne Plaza that opened in February 2025, shows how state grants derisk private capital. Developers can still lock in sites at pre-commuter-traffic prices because occupancy normally lags rail handover by about two years. Similar upside is anticipated around Kuala Lumpur’s Mass Rapid Transit 3 once approvals clear in 2026.
E-Commerce-Led Last-Mile Logistics and Dark-Store Demand Surge
E-commerce sales will climb from USD 20 billion in 2025 to USD 29 billion by 2030, yet the courier count fell to 102, signaling consolidation into larger hubs. Pos Malaysia doubled its Shah Alam footprint to 24,200 square feet, while 3PLs are reserving 100,000–200,000 square-foot boxes near major cities to meet two-hour delivery targets. Compact dark stores of 5,000–10,000 square feet, located within dense neighborhoods, now command rents 20–30% above typical warehouses and eat into secondary-mall demand. SMEs, having embraced online platforms in 2.43 million cases, gravitate to 10,000–30,000 square-foot flexible space, tightening vacancy despite tempered e-commerce CAGR. Kenanga projects fulfillment intensity will rise faster than online sales, keeping logistics landlords in a supply-led advantage.
Johor–Singapore SEZ Early-Bird Incentives Sparking Cross-Border Relocations
The new SEZ grants a 5% corporate tax rate for 15 years, luring Singaporean firms that already pledged USD 4.1 billion to Johor projects. Land near the Causeway surged, yet valuations still trail comparable plots in Singapore’s Woodlands by 60–70%, preserving arbitrage upside. Early movers enjoy preferential electricity allocations, crucial because 21 pending data-center applications would need 3.2 gigawatts of fresh capacity. Office developers are bundling co-living floors to capture commuters who cross daily by the RTS Link. This policy window remains open until 2028, after which ground rents are expected to re-rate.
Restraints Impact Analysis*
| Restraint | (~) % Impact on CAGR Forecast | Geographic Relevance | Impact Timeline |
|---|---|---|---|
| Klang Valley office oversupply maintaining elevated vacancy | –1.2% | Kuala Lumpur, Petaling Jaya, Klang | Medium term (2-4 years) |
| Volatile construction input costs squeezing developer margins | –0.9% | National | Short term (≤ 2 years) |
| ESG-linked financing tightening for non-compliant brown assets | –0.7% | Kuala Lumpur, Petaling Jaya | Long term (≥ 4 years) |
| Grid-capacity bottlenecks limiting power-dense data-center expansion | –0.6% | Johor Bahru, Selangor | Medium term (2-4 years) |
| Source: Mordor Intelligence | |||
Klang Valley Office Oversupply Maintaining Elevated Vacancy
Combined office inventory reached 121.7 million square feet in 4Q 2024, pushing vacancy to 28.3%. Yet Kuala Lumpur Fringe posted only 6.7% vacancy in 4Q 2025 because tenants gravitated toward transit-served submarkets[2]Bank Negara Malaysia, “Klang Valley Office Market Report Q4 2024,” bnm.gov.my. New construction dries up after The Capitol delivers in 2027, signaling that natural absorption should erode excess space by 2029 if hiring holds. Secondary landlords now grant fitting-out allowances of around USD 18–27 per square foot and lengthy rent-free periods, shrinking effective income. Conversion to residential is under policy review and could remove obsolete floors from supply.
Volatile Construction Input Costs Squeezing Developer Margins
Steel slid to USD 780 per tonne in December 2025 while cement hit USD 5.46 per bag, swinging contracts priced on 2023 assumptions. The official building material cost index climbed up to 2.0% month on month at year-end, and labor costs jumped after the minimum wage rose to USD 378 monthly. Developers shifted toward cost-plus design-build contracts, passing risks to occupiers via escalation clauses. Smaller firms exited, dropping active Kuala Lumpur projects from 47 in 2023 to 34 in 2025, and leaving deeper-pocketed players such as Sime Darby Property to dominate.
*Our updated forecasts treat driver/restraint impacts as directional, not additive. The revised impact forecasts reflect baseline growth, mix effects, and variable interactions.
Segment Analysis
By Property Type: Logistics Outpaces Office Despite Smaller Base
Office retained the largest 30% slice but contends with 28.3% Klang Valley vacancy, while Grade-A green towers enjoy healthy leasing. Logistics momentum rests on shrinking industrial vacancy of 2.0% as 3PLs pre-leased 2.1 million square feet and e-commerce gross merchandise value marches toward USD 29 billion by 2030. Power access is the new bottleneck, illustrated by data-center queues for 3.2 gigawatts of additional capacity. Retail stabilizes, shown by Pavilion REIT guiding toward 95% mall occupancy, and hospitality gains from Visit Malaysia 2026 with more than 2,000 five-star rooms added through Hyatt and JW Marriott openings. Environmental retrofits remain vital because non-compliant towers pay loan spreads up to 1%, hurting office cash flows, whereas warehouses require fewer ESG upgrades to remain marketable.
The Malaysia commercial real estate market share edge enjoyed by offices is eroding as institutional capital pivots toward logistics. Axis REIT’s USD 178 million Seberang Perai land purchase on an eight-year leaseback exemplifies appetite for long-income industrial. Meanwhile, green premiums let owners such as JLL Malaysia’s WELL Gold Menara IQ charge USD 1.70 per square foot monthly, versus sub-USD 1.30 elsewhere. Long term, mixed-use precincts near rail nodes will blend office, retail, and logistics micro-hubs, smoothing the cycle volatility.
Note: Segment shares of all individual segments available upon report purchase


By Business Model: Rental Dominance Reflects Capital Preservation
Rental activity accounted for 63% of the Malaysia commercial real estate market size in 2025 and is forecast to grow at an 8.33% CAGR through 2031, buoyed by corporates that prefer operating leases over capital-intensive ownership. Rental appeal deepens as construction-cost volatility makes buy-versus-lease math uncertain; cement at USD 5.46 per bag and fluctuating steel prices spike contingency budgets. REITs reinforce the pivot, with Sunway placing USD 158 million of new equity to fund acquisitions and distribute yields above 5.8%. Sales transactions persist where transit upgrades lift land prices, as seen by 43–114% gains near Bukit Chagar, but these are mostly end-user purchases rather than speculative flips.
Rental growth leads even as Kuala Lumpur vacancy drags headline figures, because logistics and retail rents climb. CapitaLand Malaysia Trust posted a 12.2% portfolio rental reversion in 2025, proving landlords can pass productivity gains onto tenants. Strata-title fractional sales, such as IGB REIT’s USD 589 million Southkey takeover, democratize ownership, yet the liquidity they create logically feeds back into stronger rental bargaining positions by institutional owners with scale.
By End-User: Corporates Lead, Yet Households Gain Share
Corporates and SMEs held a 68% Malaysia commercial real estate market share in 2025, underpinned by USD 94.8 billion in approved FDI. Individuals and households, however, register the fastest 8.40% CAGR out to 2031 as REIT units trade at entry levels below USD 500, appealing to savers seeking yields higher than 3% term deposits. SMEs adopting digital platforms—2.43 million by 2024—fragment warehouse demand into smaller flex units, reinforcing the logistics boom. Public agencies consolidate space, trimming leasing in Putrajaya by 8% in 2024, a trend that frees city-core floors yet boosts suburban conversions to co-living.
Household participation hinges on Securities Commission Malaysia keeping favorable tax pass-throughs for REITs. Any rule tightening could see growth revert to institutions. Meanwhile, corporate tenants lock in 10–15 year leases with 2–3% annual bumps, particularly in manufacturing, giving landlords predictable indexed income streams.
Note: Segment shares of all individual segments available upon report purchase
Geography Analysis
Kuala Lumpur commanded 41% of 2025 transaction value, yet its headline vacancy of 18.6% understates a sharp divide: WELL-certified towers in Tun Razak Exchange and KLCC stay above 85% occupancy, while older fringe blocks linger near 22% vacancy. Rental differentials reward investors who retrofit brown towers, and impending policy discussions on office-to-residential conversions may permanently remove obsolete stock. Transit lines such as Mass Rapid Transit 2 already rerouted tenant interest to suburban nodes, propping up asset values beyond the city core.
Johor Bahru is the fastest growing, on track for a 10.4% CAGR through 2031, courtesy of a 5% SEZ tax regime and the December 2026 opening of the RTS Link. Singapore corporates have committed USD 4.1 billion to nearby projects, and land jumped to USD 222–333 per square foot within walking distance of Bukit Chagar. Early data-center filings in Johor further underline the cross-border digital corridor, though grid constraints demand synchronized capacity planning.
Penang ranks third by value after securing USD 5 billion of electronics investment in 2025 and pushing industrial land to USD 14–19 per square foot[3]Malaysian Investment Development Authority, “Penang Manufacturing Investments 2025,” mida.gov.my. Axis REIT’s leaseback in Seberang Perai illustrates institutional confidence, but long-term absorption depends on timely delivery of the Light Rail Transit Mutiara Line by 2030. Petaling Jaya and Klang capture logistics spill-over from Klang Port, with third-party logistics players pre-leasing 100,000–200,000 square-foot boxes within 30 kilometers of Kuala Lumpur. Secondary cities such as Ipoh and Kota Kinabalu remain tourism-led, evident from Wyndham’s 188-room Semporna Resort due in 2026, yet institutional inflows stay modest.
Competitive Landscape
Malaysia commercial real estate market competition is diffuse: 18 listed REITs together hold USD 11.3 billion in market cap, and no single trust controls more than 8% of national commercial stock. Fragmentation invites mergers as smaller developers retreat amid margin pressure from cost spikes and tax reforms. Sunway REIT’s USD 100 million Pinnacle purchase, funded partly by a USD 158 million placement, and IGB REIT’s USD 589 million Southkey mall deal signal a pivot toward scale economics in portfolio management. Such moves also answer investor appetite for steady distributions in a rising-rate environment.
Strategically, players concentrate on transit-oriented mixed-use parcels. Only a handful have secured sites within 500 meters of Bukit Chagar, leaving white space for entrants able to navigate Johor land approvals. Sale-leaseback deals like Axis REIT’s USD 178 million Seberang Perai tract free up manufacturer balance sheets and lock landlords into inflation-linked income, a model likely to proliferate.
Technology habits vary. JLL notes 92% of office tenants test AI-based space tools, yet only 5% hit rollout goals, indicating that verified sustainability labels such as WELL Gold hold more commercial weight than experimental proptech. Bank Negara’s climate taxonomy accelerates this tilt: REITs with green assets borrow 50–100 basis points cheaper than owners of brown towers, a cost gap that could widen as carbon disclosure rules stiffen.
Malaysia Commercial Real Estate Industry Leaders
KLCC Property Holdings Bhd
Sunway REIT
Pavilion REIT
IGB REIT
Sime Darby Property Bhd
- *Disclaimer: Major Players sorted in no particular order

Recent Industry Developments
- January 2026: CapitaLand Malaysia Trust reported FY 2025 rental reversion of 12.2%, with retail assets showing 12.0% gains despite a 0.4% drop in shopper traffic.
- February 2025: IGB REIT finalized the USD 589 million purchase of Mid Valley Southkey mall, adding 1.5 million square feet at a 4.31% yield.
- December 2024: Hyatt Centric City Centre Kuala Lumpur began operations with 312 rooms and 200,000 square feet of pre-leased Grade-A office space.
- November 2024: Sunway REIT agreed to buy The Pinnacle Sunway for USD 100 million and announced a USD 158 million equity placement to fund further growth.


Malaysia Commercial Real Estate Market Report Scope
Commercial real estate (CRE) is the land only used for business-related activities or to offer a workspace instead of being utilized as a residence, which would fall under the residential real estate category. Most frequently, renters lease commercial real estate to conduct businesses that generate cash. The report also covers the impact of COVID-19 on the market.
The Malaysia Commercial Real Estate Market is segmented by type (offices, retail, industrial, logistics, multi-family, and hospitality) and key cities (Kuala Lumpur, Seberang Perai, Kajang, Klang, and the rest of Malaysia). The report offers market size and forecasts for the Malaysia Commercial Real Estate market in value (USD) for all the above segments.
By Property Type
| Offices |
| Retail |
| Logistics |
| Others (industrial real estate, hospitality real estate, etc.) |
By Business Model
| Sales |
| Rental |
By End-user
| Individuals / Households |
| Corporates & SMEs |
| Others |
By Geography
| Kuala Lumpur |
| Klang |
| Petaling Jaya |
| Johor Bahru |
| Penang (George Town, Seberang Perai) |
| Rest of Malaysia |
| By Property Type | Offices |
| Retail | |
| Logistics | |
| Others (industrial real estate, hospitality real estate, etc.) | |
| By Business Model | Sales |
| Rental | |
| By End-user | Individuals / Households |
| Corporates & SMEs | |
| Others | |
| By Geography | Kuala Lumpur |
| Klang | |
| Petaling Jaya | |
| Johor Bahru | |
| Penang (George Town, Seberang Perai) | |
| Rest of Malaysia |


Key Questions Answered in the Report
How large will Malaysia commercial real estate be by 2031?
It is projected to reach USD 15.05 billion, expanding from USD 10.30 billion in 2026 at a 7.81% CAGR.
Which property type is growing fastest in Malaysia?
Logistics space is forecast to post an 11.20% CAGR between 2026-2031, the quickest among all asset classes.
Why are rentals preferred over sales deals?
Corporates preserve cash amid volatile input costs, and rentals already held a 63% share in 2025 with an 8.33% forecast CAGR.
What drives Johor Bahru’s strong growth?
A 5% SEZ tax, USD 4.1 billion Singapore investor commitments, and the 2026 RTS Link opening should yield a 10.4% CAGR to 2031.
How is ESG regulation affecting offices?
Bank Negara’s taxonomy adds up to 100 basis points on brown-asset loans, pushing owners toward retrofits or facing higher vacancies.
Page last updated on:


