Asia-Pacific Amusement Park Market Size and Share
Market Overview
| Study Period | 2021 - 2031 |
|---|---|
| Forecast Data Period | 2026 - 2031 |
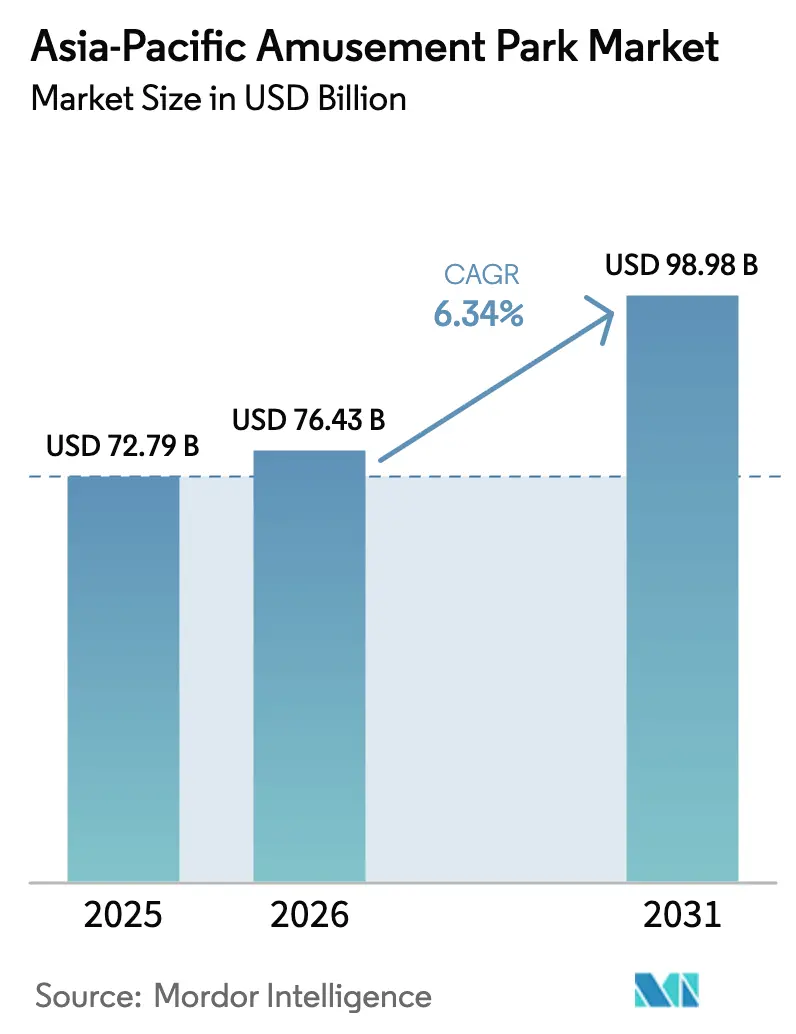
| Base Year Market Size (2025) | USD 72.79 Billion |
| Market Size (2026) | USD 76.43 Billion |
| Market Size (2031) | USD 98.98 Billion |
| Growth Rate (2026 - 2031) | 6.34% CAGR |
| Market Concentration | Low |
Major Players *Disclaimer: Major Players sorted in no particular order Image © Mordor Intelligence. Reuse requires attribution under CC BY 4.0. | |
Asia-Pacific Amusement Park Market Analysis by Mordor Intelligence
The Asia-Pacific amusement park market reached USD 72.79 billion in 2025, is projected at USD 76.43 billion in 2026, and is forecast to reach USD 98.98 billion by 2031, reflecting a 6.34% CAGR from 2026 to 2031, which signals steady scale-up in spending and investment across the region. Growth is reinforced by sustained middle-class expansion and a strong pipeline of destination-scale projects, which is improving capacity utilization and average revenue per guest through integrated hotels and branded retail formats. Attendance recovery and cross-border travel normalization are helping operators deploy yield management practices and more efficient virtual queue systems that raise throughput while addressing seasonal bottlenecks. The region’s competitive landscape tilts toward localized IP and large campus-style investments, and the balance between high capital intensity and rising per-capita spending is shaping a flight to quality among multi-park operators. Environmental performance is also influencing permitting efficiency and customer perception, with operators who can demonstrate credible decarbonization and circularity programs often achieving smoother regulatory progress and stronger corporate demand from MICE clients.
Key Report Takeaways
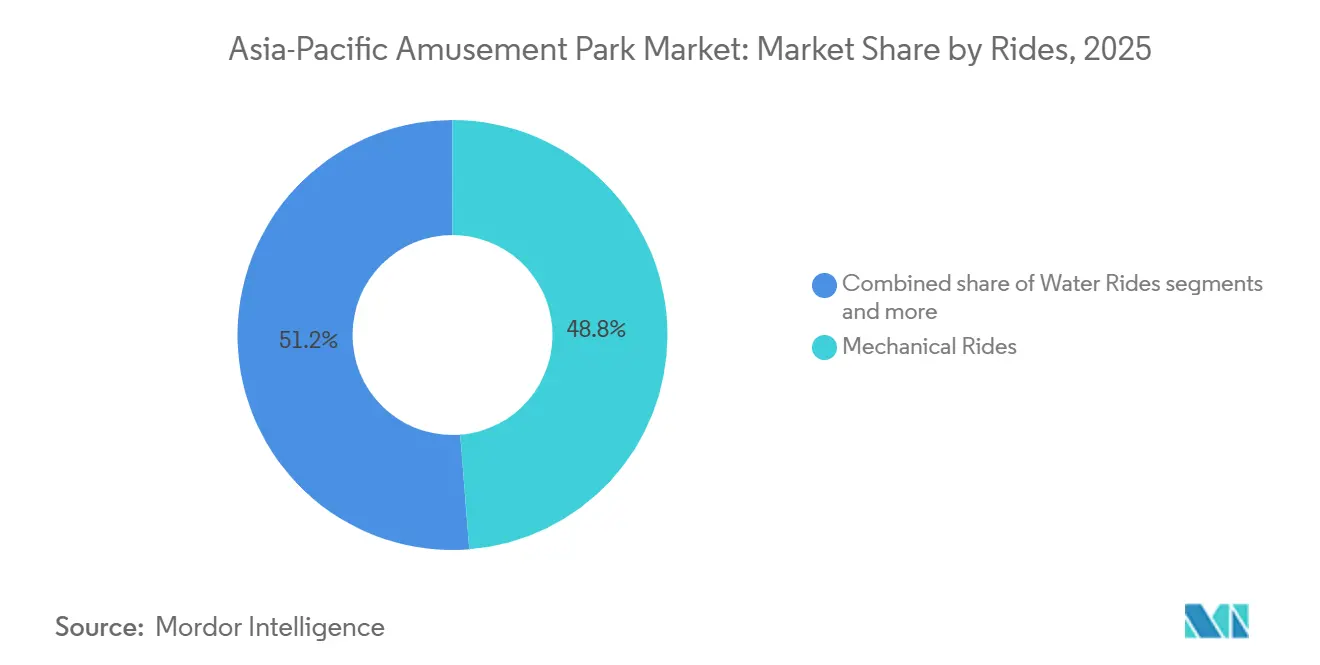
- By rides, mechanical rides led with 48.75% of the Asia-Pacific amusement park market share in 2025, while other rides are projected to expand at an 11.87% CAGR through 2031.
- By age, the 19-35 years cohort accounted for 37.78% of the Asia-Pacific amusement park market share in 2025, while the 51-65 years cohort recorded the fastest projected growth at 18.76% CAGR through 2031.
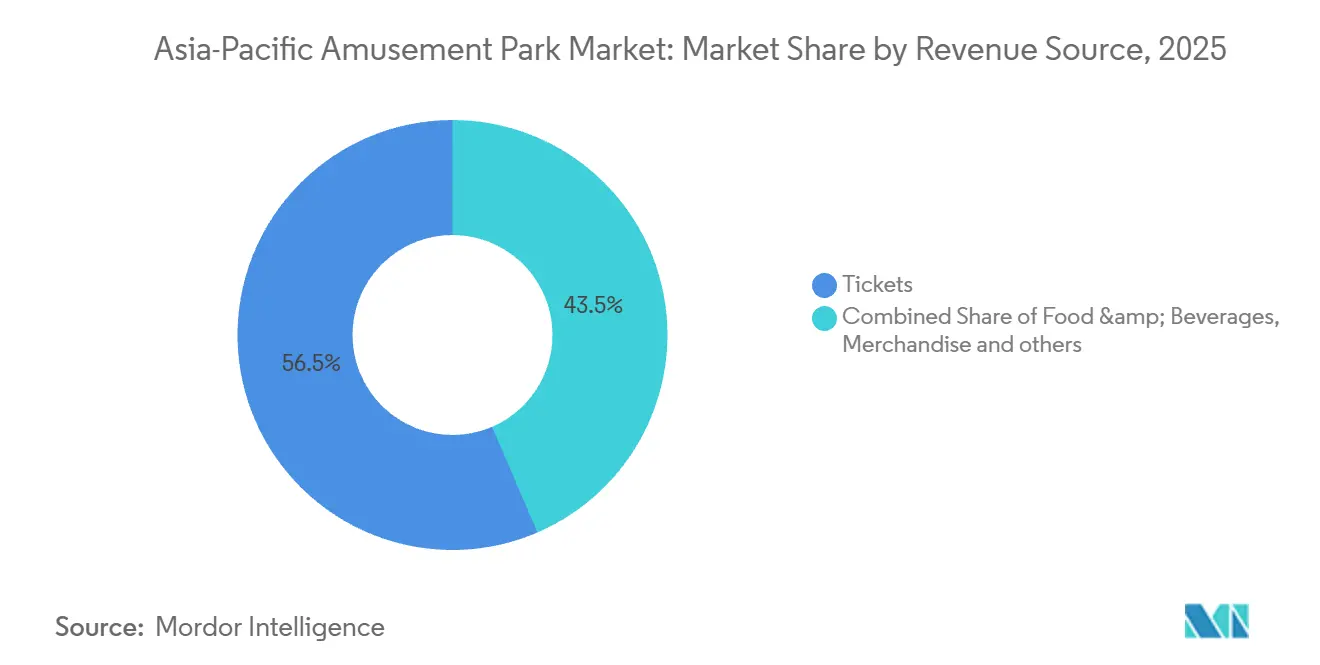
- By revenue source, tickets held 56.47% of the Asia-Pacific amusement park market share in 2025, while hotels and resorts are projected to expand at a 10.87% CAGR through 2031.
- By geography, China held 43.62% of the Asia-Pacific amusement park market share in 2025, while India recorded the highest projected CAGR at 15.98% through 2031.
Note: Market size and forecast figures in this report are generated using Mordor Intelligence’s proprietary estimation framework, updated with the latest available data and insights as of 2026.
Asia-Pacific Amusement Park Market Trends and Insights
Drivers Impact Analysis*
| Driver | (~) % Impact on CAGR Forecast | Geographic Relevance | Impact Timeline |
|---|---|---|---|
| Strengthening Consumer Spending in the APAC Middle Class | + 1.8% | Global, concentrated in China, India, and Southeast Asia, core markets | Medium term (2-4 years) |
| Accelerated Urban Growth and Large-Scale Infrastructure Projects | + 1.5% | APAC-wide, strongest in China, India, Indonesia, Vietnam | Medium to Long term (2-4+ years) |
| Government Initiatives to Boost Travel and Leisure | + 1.2% | APAC-wide, concentrated in emerging markets like the Philippines, Vietnam, and Thailand. | Short to Medium term (≤ 4 years) |
| Growth of Intellectual Property–Driven Attractions | + 0.9% | Global, spill-over to China, Japan, Australia, Singapore, India | Medium term (2-4 years) |
| Smart Ticketing and Dynamic Pricing Drive Earnings | + 0.6% | Global early adoption, APAC core markets following, including China and Japan | Short term (≤ 2 years) |
| Sustainability-Focused Infrastructure Accelerates Project Approvals | + 0.5% | Strongest in Australia, Singapore, Japan, emerging in China and India | Medium to Long term (2-4+ years) |
| Source: Mordor Intelligence | |||
Strengthening Consumer Spending in the APAC Middle Class
Asia represents a significant and expanding share of global theme park revenues, highlighting the growing spending power of urban middle-income households across China, India, and Southeast Asia. The Asia-Pacific amusement park market is closely aligned with this trend, as rising discretionary incomes encourage longer stays, higher spending on premium experiences, and multi-day visits. Forecasts indicate that Asia’s discretionary consumption will expand from USD 23 trillion in 2025 to USD 35 trillion by 2035, supporting demand for integrated destinations that combine rides, hotels, and immersive retail.[1]Pacific Asia Travel Association, “Asia Pacific Snapshot: Weekly Travel Recovery Dashboard,” Pacific Asia Travel Association, pata.org. Global theme park demand continues to strengthen, with the top 10 amusement and theme park operator groups worldwide recording total attendance of 532.5 million in 2023, increasing to 549.9 million in 2024, reflecting a 3.3% year-over-year rise. This steady growth signals improving household purchasing power and higher discretionary spending, particularly across the Asia Pacific, where rising disposable incomes are driving longer visits, premium ticket upgrades, and greater spending on experience-focused attractions within the amusement park market.[2]Source: Themed Entertainment Association, “TEA Global Experience Index 2024 Global Attractions Attendance Report,” Themed Entertainment Association, teaconnect.org.
Accelerated Urban Growth and Large-Scale Infrastructure Projects
Thailand is exploring a major “Disneyland‑style” theme park in its Eastern Economic Corridor (EEC) as a cornerstone of large‑scale urban and tourism development. The government is planning land use and incentives to attract a world‑class park alongside other megaprojects, such as an 80,000‑seat international stadium and high‑speed rail linking three airports, positioning the EEC as a diversified entertainment and investment hub. Officials believe such mega‑projects will stimulate year‑round tourism, unlock further infrastructure investment, and boost regional economic growth.[3]Thailand PR Department, “Thailand eyes Disneyland-style theme park in EEC,” thailand.go.th. In China, expansion programs around Shanghai Disney Resort and Universal Beijing Resort anchor multi-use entertainment precincts that integrate hotels and retail to drive longer stays and higher per-capita spend. Singapore’s integrated resort strategy continues to scale with the RWS 2.0 upgrade, which includes the expanded Singapore Oceanarium and new luxury lodging that together elevate the value proposition for both leisure and MICE segments.[4]Resorts World Sentosa, “RWS Sustainability Fact Sheet,” Resorts World Sentosa, rwsentosa.com. In Indonesia, PT MNC Tourism Indonesia’s acquisition of a 55% stake in PT Kios Ria Kreasi supports a 98.02-hectare international theme park, water park, and resort complex in West Bali, further signaling multi-year capex commitments in Southeast Asia’s most promising leisure corridors.[5]PT MNC Tourism Indonesia Tbk, “9M 2025 Performance: Strengthening Expansion,” mnctourismindonesia.com.
Government Initiatives to Boost Travel and Leisure
Visa relaxations, duty-free allowances, and targeted hospitality incentives have become key levers for travel recovery and attraction-led development. China broadened visa-free access in 2025 and 2026 to boost international arrivals and length of stay, supporting regional leisure corridors and boosting weekend and holiday demand at urban parks. Japan’s record international arrivals in 2024 and the staging of Expo 2025 in Osaka sustain near-term visitation momentum, strengthening seasonal calendars and boosting attendance at nearby flagship parks.[6]Pacific Asia Travel Association, “Asia Pacific Snapshot: Weekly Travel Recovery Dashboard,” Pacific Asia Travel Association, pata.org. Southeast Asian governments have complemented visa policies with land-lease facilitation and fiscal incentives to fast-track enabling infrastructure, thereby lowering time-to-market and encouraging foreign IP partnerships. The Asia-Pacific amusement park market benefits when these measures focus on sub-regions with rising middle-class populations, as operators can secure earlier payback through stronger off-peak occupancy and diversified on-site spending.
Smart Ticketing and Dynamic Pricing Drive Earnings
Digital operations now influence throughput, dwell time, and upsell conversion across flagship and regional parks. Disney’s virtual queues demonstrate how controlled access windows can smooth arrivals and reduce perceived wait times, which enables better staffing alignment and a more predictable guest flow pattern. Admissions and ancillary items increasingly adopt dynamic-pricing logic that responds to demand volatility, seasonal swings, and inventory constraints, which expands revenue without undermining brand positioning. Early adopters are combining digital reservation tools with personalized offers to shift guests into shoulder periods, and real-time alerts protect on-time start rates for shows and parades. The Asia-Pacific amusement park market will see greater emphasis on data-driven pricing and capacity optimization as operators roll out new dark rides, indoor experiences, and nighttime programming that benefit from demand shaping and yield controls.
Restraints Impact Analysis*
| Restraint | (~) % Impact on CAGR Forecast | Geographic Relevance | Impact Timeline |
|---|---|---|---|
| High Capital Expenditure and Extended Return on Investment | - 1.4% | Global, particularly acute in China, India, Japan, and Australia | Long term (≥ 4 years) |
| Attendance Fluctuations Driven by Seasonal Factors | - 0.8% | Global, monsoons across Southeast Asia and winter in Northern Asia | Recurring annually |
| Cybersecurity Vulnerabilities in Digital Ticketing and Wristband Systems | -0.5% | Developed APAC markets with digital integration | Short term (≤ 2 years) |
| Aging Ride Infrastructure and Safety-Related Incidents | -0.7% | Established markets with legacy assets | Medium term (2-4 years) |
| Source: Mordor Intelligence | |||
High Capital Expenditure and Extended Return on Investment
Large-scale park development in Asia-Pacific often exceeds USD 500 million in capex, and payback timelines generally extend across multiple planning cycles as ride commissioning and hotel openings are phased. Investment programs in integrated resort districts emphasize premium hotels, signature attractions, and event facilities, which improve long-term asset value but require patient capital and strong pre-opening working capital. Operators that control multiple assets in a cluster can balance refurbishment downtime against headline events and nighttime shows to protect attendance and guest satisfaction during construction waves. The Asia-Pacific amusement park market, therefore, trends toward scaled owners with diversified revenue lines, deeper funding sources, and the ability to cross-market across parks and hotels to improve cash conversion. In this environment, mid-tier operators often delay large capital commitments or pursue modular projects that can be commissioned in smaller phases with less exposure to supply-chain shocks and permitting delays.
Attendance Fluctuations Driven by Seasonal Factors
Attendance patterns across APAC vary sharply by monsoon and winter seasons, which pressures revenue management and complicates staffing and maintenance schedules. In Japan, marquee assets maintain strong brand equity yet still contend with concentrated peaks that align with holidays and favorable weather, and this puts a premium on special events and intellectual property tie-ins that can extend the high season. Parks across the region have added indoor attractions and escalated nighttime entertainment to smooth distribution across the day and calendar, and targeted promotions now nudge demand into weekdays and shoulder months. Leading parks with on-site hotels and convention facilities offer more options to defend occupancy during inclement periods, and cross-ticket bundles can distribute guests across attractions with higher weather resilience. The Asia-Pacific amusement park market continues to invest in queue management and capacity planning tools that help mitigate volatility, though structural seasonality still drives lumpy cash flows that require careful capex timing and liquidity planning.
*Our updated forecasts treat driver/restraint impacts as directional, not additive. The revised impact forecasts reflect baseline growth, mix effects, and variable interactions.
Segment Analysis
By Rides: Mechanical Dominance Meets Virtual Innovation
Mechanical rides accounted for 48.75% of revenue share in 2024, which preserved their anchor status within guest expectations, while the category’s forward growth moderates as steel and commissioning costs increase. Other rides, which incorporate AR and VR-enabled dark rides and interactive media, are the fastest-growing subset at 11.87% CAGR, as operators respond to at-home digital entertainment by elevating immersion and interactivity. Ride procurement decisions are increasingly shaped by lifecycle costs and sustainability standards, where energy-efficient drives and low-maintenance designs align with ISO 14001 environmental management and ASTM F24 ride safety standards used by regulators and certifiers. The Asia-Pacific amusement park market is also leaning into signature mechanical installations that deliver higher capacity per hour, and into complementary nighttime shows that improve per-capita spend and shoulder-hour dwell times.
The Asia-Pacific amusement park industry is seeing mechanical categories complemented by data-driven virtual experiences that make throughput more predictable and ride resets faster. Flagship AR-integrated rides underscore how physical coasters and tracked media experiences can co-exist and cross-promote, with product design linking on-ride and in-app experiences that expand the monetization window. Operators in Australia have introduced high-profile mechanical upgrades, such as new-generation gyro swing rides, to refresh their core offer and to pair with refreshed precincts for higher guest satisfaction and intent to return. Across APAC, mechanical reliability and digital overlays now move in tandem as operators prioritize scalable systems that can be updated with content refreshes rather than heavy hardware swaps, which reduces downtime during peak seasons. This mix positions the Asia-Pacific amusement park market to preserve the draw of headline rides while expanding capacity through virtual queue tools that lift premium participation and help stagger use across the day.
Note: Segment shares of all individual segments available upon report purchase
By Age: Youth Drive Visits, Seniors Drive Growth
The 19-35 years cohort accounted for 37.78% of the share in 2024 and remains the most active segment in terms of frequency, social sharing, and receptivity to IP-led experiences and interactive media. The up-to-18 years segment anchors family visits and supports education-linked programming and animal-focused attractions that show resilient traction with school calendars. The 36-50 years segment functions as the household decision-maker in many markets and tends to balance children’s preferences with premium dining and lodging options, which has helped multi-day tickets gain adoption. Youth-oriented demand continues to benefit from branded collaborations and seasonal events that refresh the experience map and deliver discoverable content across app channels. The Asia-Pacific amusement park market, therefore, relies on a mix of high-intensity thrill rides and media-rich dark rides to sustain visit frequency among younger cohorts while moving family segments toward longer stays and bundled upgrades.
The 51-65 years cohort is the fastest-growing at 18.76% CAGR to 2030, yet remains smaller in absolute size, which suggests a targeted expansion opportunity for accessible attractions, scenic experiences, and wellness-centered programming. Senior-friendly amenities and universal design features are becoming more visible across major parks, and this improves group dynamics for multi-generational travel that includes grandparents and caregivers. As richer content libraries enable multiverse-style media overlays, operators can tailor experiences by age cohort within the same precinct, which raises secondary spend and improves repeat visitation. The Asia-Pacific amusement park industry is expected to deliver more curated experiences for this fast-growing senior segment, tightening links to hospitality, gardens, aquariums, and cultural programming that complement headline rides. Over time, this diversification strengthens household-level willingness to pay because the full family unit finds more reasons to add a day, stay on-site, and engage with special access privileges.
By Revenue Source: Tickets Anchor, Hotels Accelerate
Tickets accounted for 56.47% of revenue in 2024 and remain the primary revenue anchor, with dynamic pricing and queue management helping operators capture more value while managing crowding and improving show start rates. Food and beverages, and experiential dining formats have validated a stronger pricing power that leverages IP tie-ins and live entertainment. Merchandise reflects stronger localization and season-exclusive collections that encourage on-site and post-visit purchases. Hotels and resorts are the fastest-growing line at 10.87% CAGR through 2031, driving higher per-capita spend through extended stays, premium access, and evening programs that extend operating windows. The Asia-Pacific amusement park market is also seeing incremental gains in sponsorships, events, and corporate bookings as sustainability credentials improve, which helps attract MICE demand with formal supplier standards and benchmarking.
Revenue optimization is moving from one-time tickets to multi-day bundles and premium passes as parks refine capacity allocation between general admission and express experiences. Major openings like LEGOLAND Shanghai are designed with on-site hotels and multiple themed lands, which underpins bundled offers and room-night capture across weekends and school holidays. In Singapore, RWS 2.0 demonstrates how integrated aquariums, new luxury rooms, and refreshed retail corridors can raise non-ticket revenue per guest alongside park attendance. The Asia-Pacific amusement park market size for hotels and resorts is projected to expand steadily as more operators activate co-located lodging and as destination districts prove resilient against seasonality. This revenue diversification softens earnings volatility and enables multi-year reinvestment programs that rely on stronger cash conversion from overnight and multi-day itineraries.
Note: Segment shares of all individual segments available upon report purchase
Geography Analysis
China dominates the Asia-Pacific amusement park market, holding a 43.62% share in 2025 and anchoring regional attendance and investment through leading domestic operators and two major global-branded destination resorts. According to the TEA Global Experience Index, China’s top operators, including Chimelong Group and OCT, rank among the world’s highest in attendance, underscoring the country’s scale advantage and deep product pipelines. The opening of LEGOLAND Shanghai Resort in July 2025 highlights the trend of branded family parks that combine themed lodging, interactive rides, and destination retail. Early 2025 domestic travel metrics show longer multi-day trips, supporting seasonal peaks and extending shoulder periods for urban precincts. These dynamics shape the Asia-Pacific market, where content refresh cycles and park upgrades drive revisit rates and guest spending growth.
India is emerging as the fastest-growing market, projected to grow at a 15.98% CAGR from 2025 to 2030, fueled by rising urban incomes that support multi-park footprints and integrated resorts. Several domestic projects are underway in major metros, with operators aligning fundraising and investment strategies to the expansion of family entertainment spend and domestic tourism. Southeast Asia is driven by tourism development agendas and resort corridors integrating theme parks with hospitality and retail clusters. Indonesia’s planned large-scale resort in West Bali illustrates the growing momentum of premium destination parks in high-growth leisure hubs. Across these markets, strong household formation and government support for tourism services enhance local employment and supplier ecosystems, reinforcing overall market expansion.
Competitive Landscape
The Asia-Pacific amusement park market is moderately fragmented outside of China and Japan, where leading domestic operators and global brand licensees set the benchmark for capacity, IP execution, and retail experiences. China’s top operators, such as Chimelong and OCT, benefit from advantages in fundraising, supplier agreements, and media partnerships that smaller parks cannot easily match. In Australia, Village Roadshow Theme Parks maintained strong guest engagement by renewing precincts and adding new rides, supporting longer stays and repeat visits across the cluster. Singapore’s integrated resort model illustrates how combining entertainment, hospitality, and attractions can strengthen corporate demand and sponsorships while building brand reputation. Overall, the market rewards operators that integrate destination real estate, recognizable IP, and credible sustainability credentials to meet the expectations of regulators and corporate clients.
Leading operators are focusing on IP expansion, mixed-use real estate, and digitalization to improve utilization and revenue across the day and throughout the year. Universal Studios Japan continues to leverage popular cultural and gaming brands through seasonal programs that enhance repeat visitation. Merlin Entertainments has developed immersive experiences based on widely recognized gaming IP, demonstrating the enduring appeal of interactive family attractions. LEGOLAND Shanghai showcases the park-as-resort model by combining themed lands with lodging to drive multi-day visitation in major cities. Sustainability initiatives are also influencing market dynamics, as operators highlight efficiency improvements and environmental responsibility in their operations, which can affect corporate and family travel choices.
Across the region, operators are adopting multi-park, multi-day strategies that pair capital-intensive attractions with media-driven overlays and event calendars to maintain novelty. Digital queueing systems and dynamic pricing have become standard, enabling premium access tiers and higher guest spend. In China, high attendance at top-tier parks reinforces the growth of integrated resort districts, combining daytime attractions with nighttime entertainment and retail for extended stays. Southeast Asia’s development pipeline, including projects in Thailand’s EEC and West Bali, reflects a growing footprint of branded destination parks. As these projects come online, demand will increasingly concentrate around airport-adjacent clusters, intensifying competition for high-profile IP and content partnerships.
Asia-Pacific Amusement Park Industry Leaders
Chimelong Group
OCT Enterprise (Happy Valley)
Universal Studios Japan (USJ LLC)
Village Roadshow Theme Parks
Fantawild Holdings
- *Disclaimer: Major Players sorted in no particular order
Recent Industry Developments
- February 2026: Thailand’s Deputy Prime Minister confirmed the country is pursuing Southeast Asia’s first Disneyland in the Eastern Economic Corridor, with the plan estimated at USD 6.6 billion through 2050, targeted to generate over THB 150 billion per year and create over 100,000 jobs.
- November 2025: Universal Studios Japan announced Universal Cool Japan 2026, launching January 30, 2026, featuring immersive attractions based on popular Japanese franchises such as Detective Conan, JUJUTSU KAISEN, and Monster Hunter Wilds. The event highlights USJ’s strategy to leverage iconic IP to boost attendance and seasonal appeal, offering story rides, 4D shows, mystery experiences, and an AR quest that enhances multi-day visitation and international tourist engagement.
- September 2025: The LEGO Group announced it will acquire all LEGO® Discovery Centres and LEGOLAND® Discovery Centres from Merlin Entertainments, bringing these 29 indoor family entertainment venues fully under LEGO’s control as part of its global brand expansion strategy. The acquisition strengthens LEGO’s direct presence in themed experiences and retail‑driven attractions, while Merlin will continue operating LEGOLAND parks under licence.
- August 2025: PT MNC Tourism Indonesia acquired a 55% controlling stake in PT Kios Ria Kreasi to develop a 98.02-hectare international theme park, water park, and resort complex at KBS Park in West Bali, and advanced construction at the MNC Lido City Tourism Special Economic Zone.
Asia-Pacific Amusement Park Market Report Scope
Amusement Park is a place that includes many games and rides (such as roller coasters and merry-go-rounds) for entertainment. This report will provide a detailed analysis of the Asia-Pacific amusement parks market. It focuses on the market dynamics, emerging trends in the segments and regional markets, and insights into the various product and application types. Also, it analyzes the key players and the competitive landscape.
The Asia-Pacific Amusement Parks Market Is Segmented By Rides (Mechanical Rides, Water Rides, And Other Rides), Age (Up To 18 Years, 19 To 35 Years, 36 To 50 Years, 51 To 65 Years, And More Than 65 Years), Revenue Source (Tickets, Food & Beverages, Merchandise, Hotels/Resorts, And Others), And Country (Japan, India, China, And Rest Of Asia-Pacific). The Report Offers Market Size And Forecasts In Value (USD) For All The Above Segments.
| Mechanical Rides |
| Water Rides |
| Other Rides |
| Upto 18 years |
| 19 to 35 years |
| 36 to 50 years |
| 51 to 65 years |
| More than 65 years |
| Tickets |
| Food & Beverages |
| Merchandise |
| Hotels/Resorts |
| Others |
| India | |
| China | |
| Japan | |
| Australia | |
| South Korea | |
| South-East Asia | Singapore |
| Malaysia | |
| Thailand | |
| Indonesia | |
| Vietnam | |
| Philippines |
| By Rides | Mechanical Rides | |
| Water Rides | ||
| Other Rides | ||
| By Age | Upto 18 years | |
| 19 to 35 years | ||
| 36 to 50 years | ||
| 51 to 65 years | ||
| More than 65 years | ||
| By Revenue Source | Tickets | |
| Food & Beverages | ||
| Merchandise | ||
| Hotels/Resorts | ||
| Others | ||
| By Country | India | |
| China | ||
| Japan | ||
| Australia | ||
| South Korea | ||
| South-East Asia | Singapore | |
| Malaysia | ||
| Thailand | ||
| Indonesia | ||
| Vietnam | ||
| Philippines | ||
Key Questions Answered in the Report
What is the Asia-Pacific amusement park market size and growth outlook to 2031?
The Asia-Pacific amusement park market is USD 72.79 billion in 2025, projected at USD 76.43 billion in 2026, and is forecast to reach USD 98.98 billion by 2031 at a 6.34% CAGR from 2026 to 2031.
Which countries lead the Asia-Pacific amusement park market by scale and growth?
China leads by scale with a 43.62% share in 2025, while India is the fastest-growing at a 15.98% CAGR through 2030 based on current development and demand fundamentals.
Which ride categories are most important for the Asia-Pacific amusement park market?
Mechanical rides hold the largest share at 48.75% in 2024, while AR and VR-enabled “other rides” are the fastest growing at 11.87% CAGR through 2031 as operators compete with digital entertainment.
How are operators increasing revenue per guest in Asia-Pacific parks?
Operators are deploying virtual queues and dynamic pricing to shape demand, expanding hotel capacity for multi-day stays, and scaling experiential dining and retail to lift non-ticket revenue lines.
What segments of visitors are most influential for sustained visitation?
The 19-35 years cohort is the largest by share at 37.78% in 2024, and drives repeat visits through IP-rich and interactive experiences, while the 51-65 years cohort is the fastest-growing, which supports accessible and wellness-focused offerings.


